

Pillar I
Basic Needs and Wellbeing Dashboard
1 - Food Security
2 - Transportation
3 - Child care
4 - Housing
5 - Health
6 - Prescription drug coverage awareness

Food Security
Food insecurity, as defined by the PROOF research project at the University of Toronto, refers to a “compromise in quality and/or quantity of food due to a lack of money for food”.
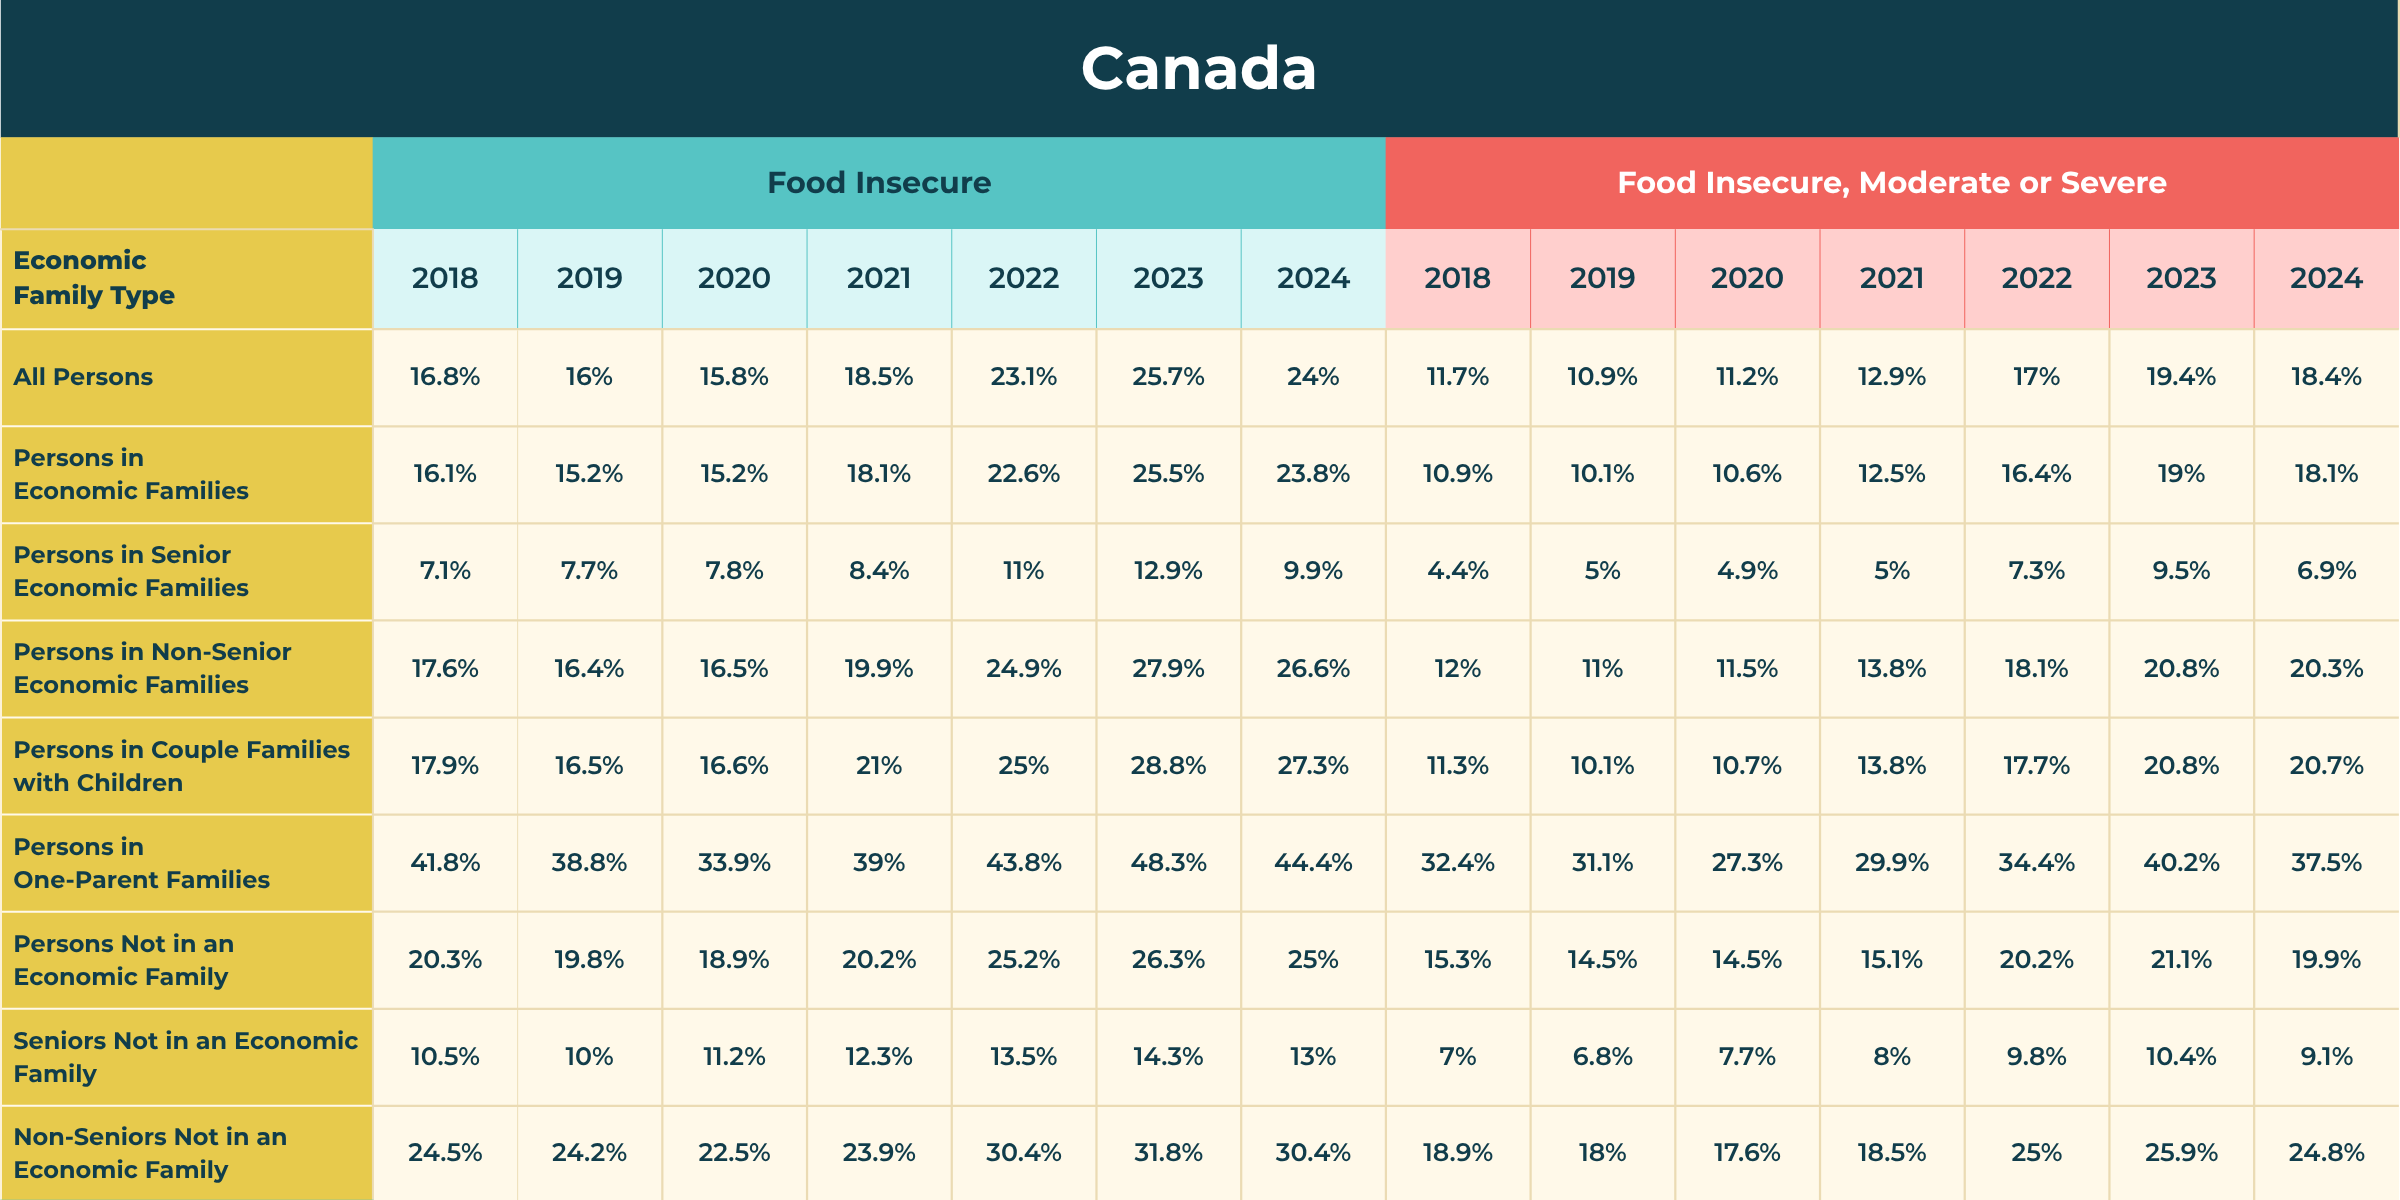
Children have the highest rate of food insecurity among all age groups in Canada — 24.3% in 2022, which translates to almost 1.8 million children. This is an increase from 1.4 million children in 2021, co-occurring with the rise in child poverty.
Nearly 9 million people (23%) are living in food-insecure households in Canada.
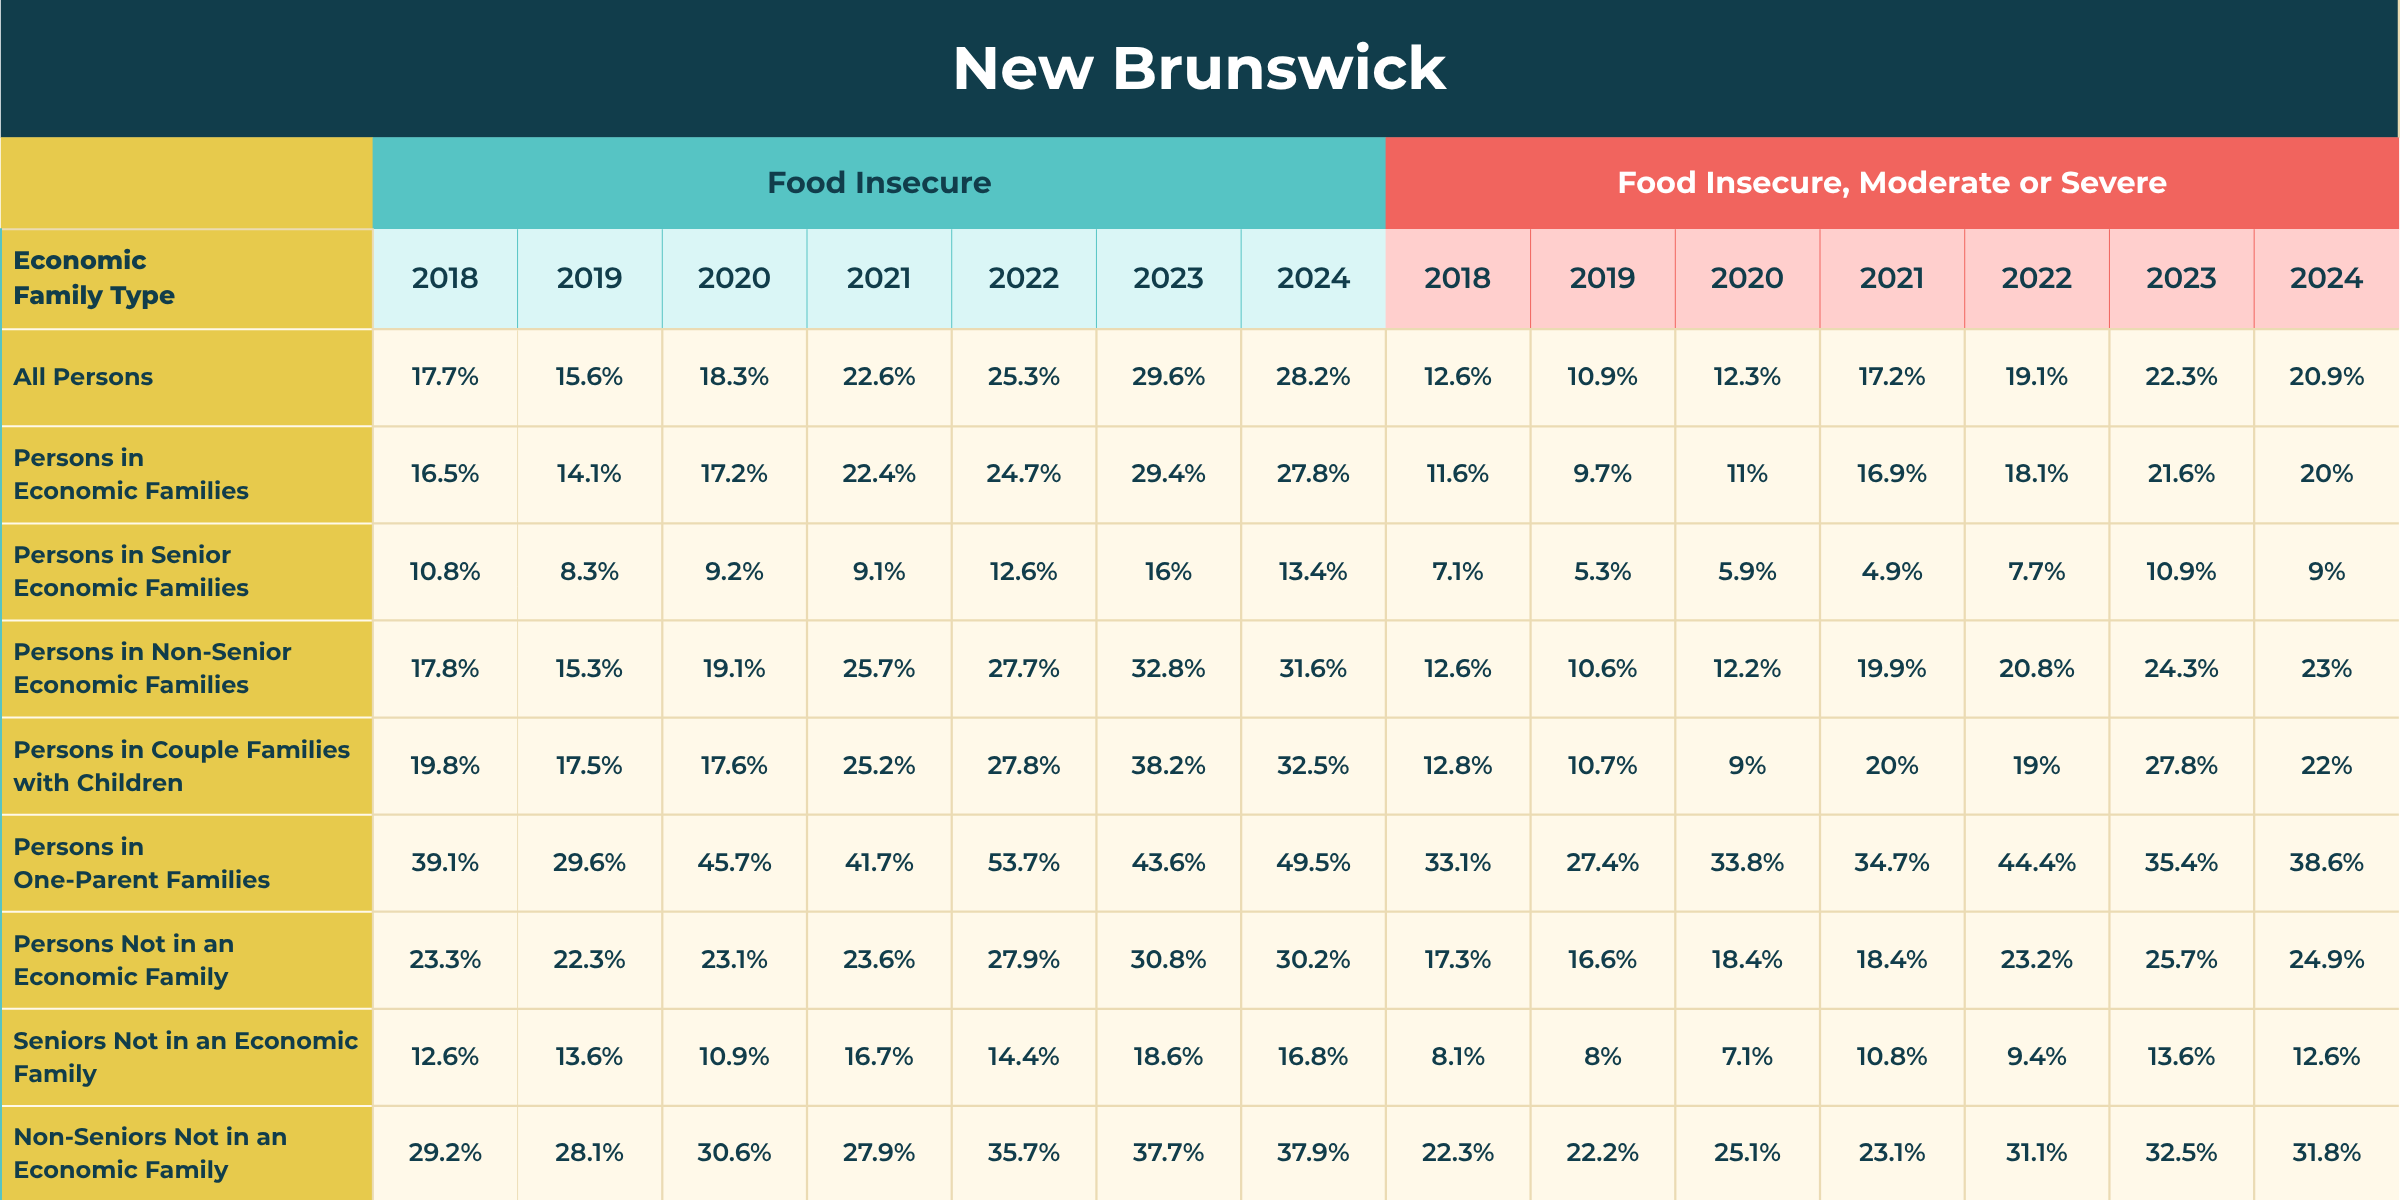
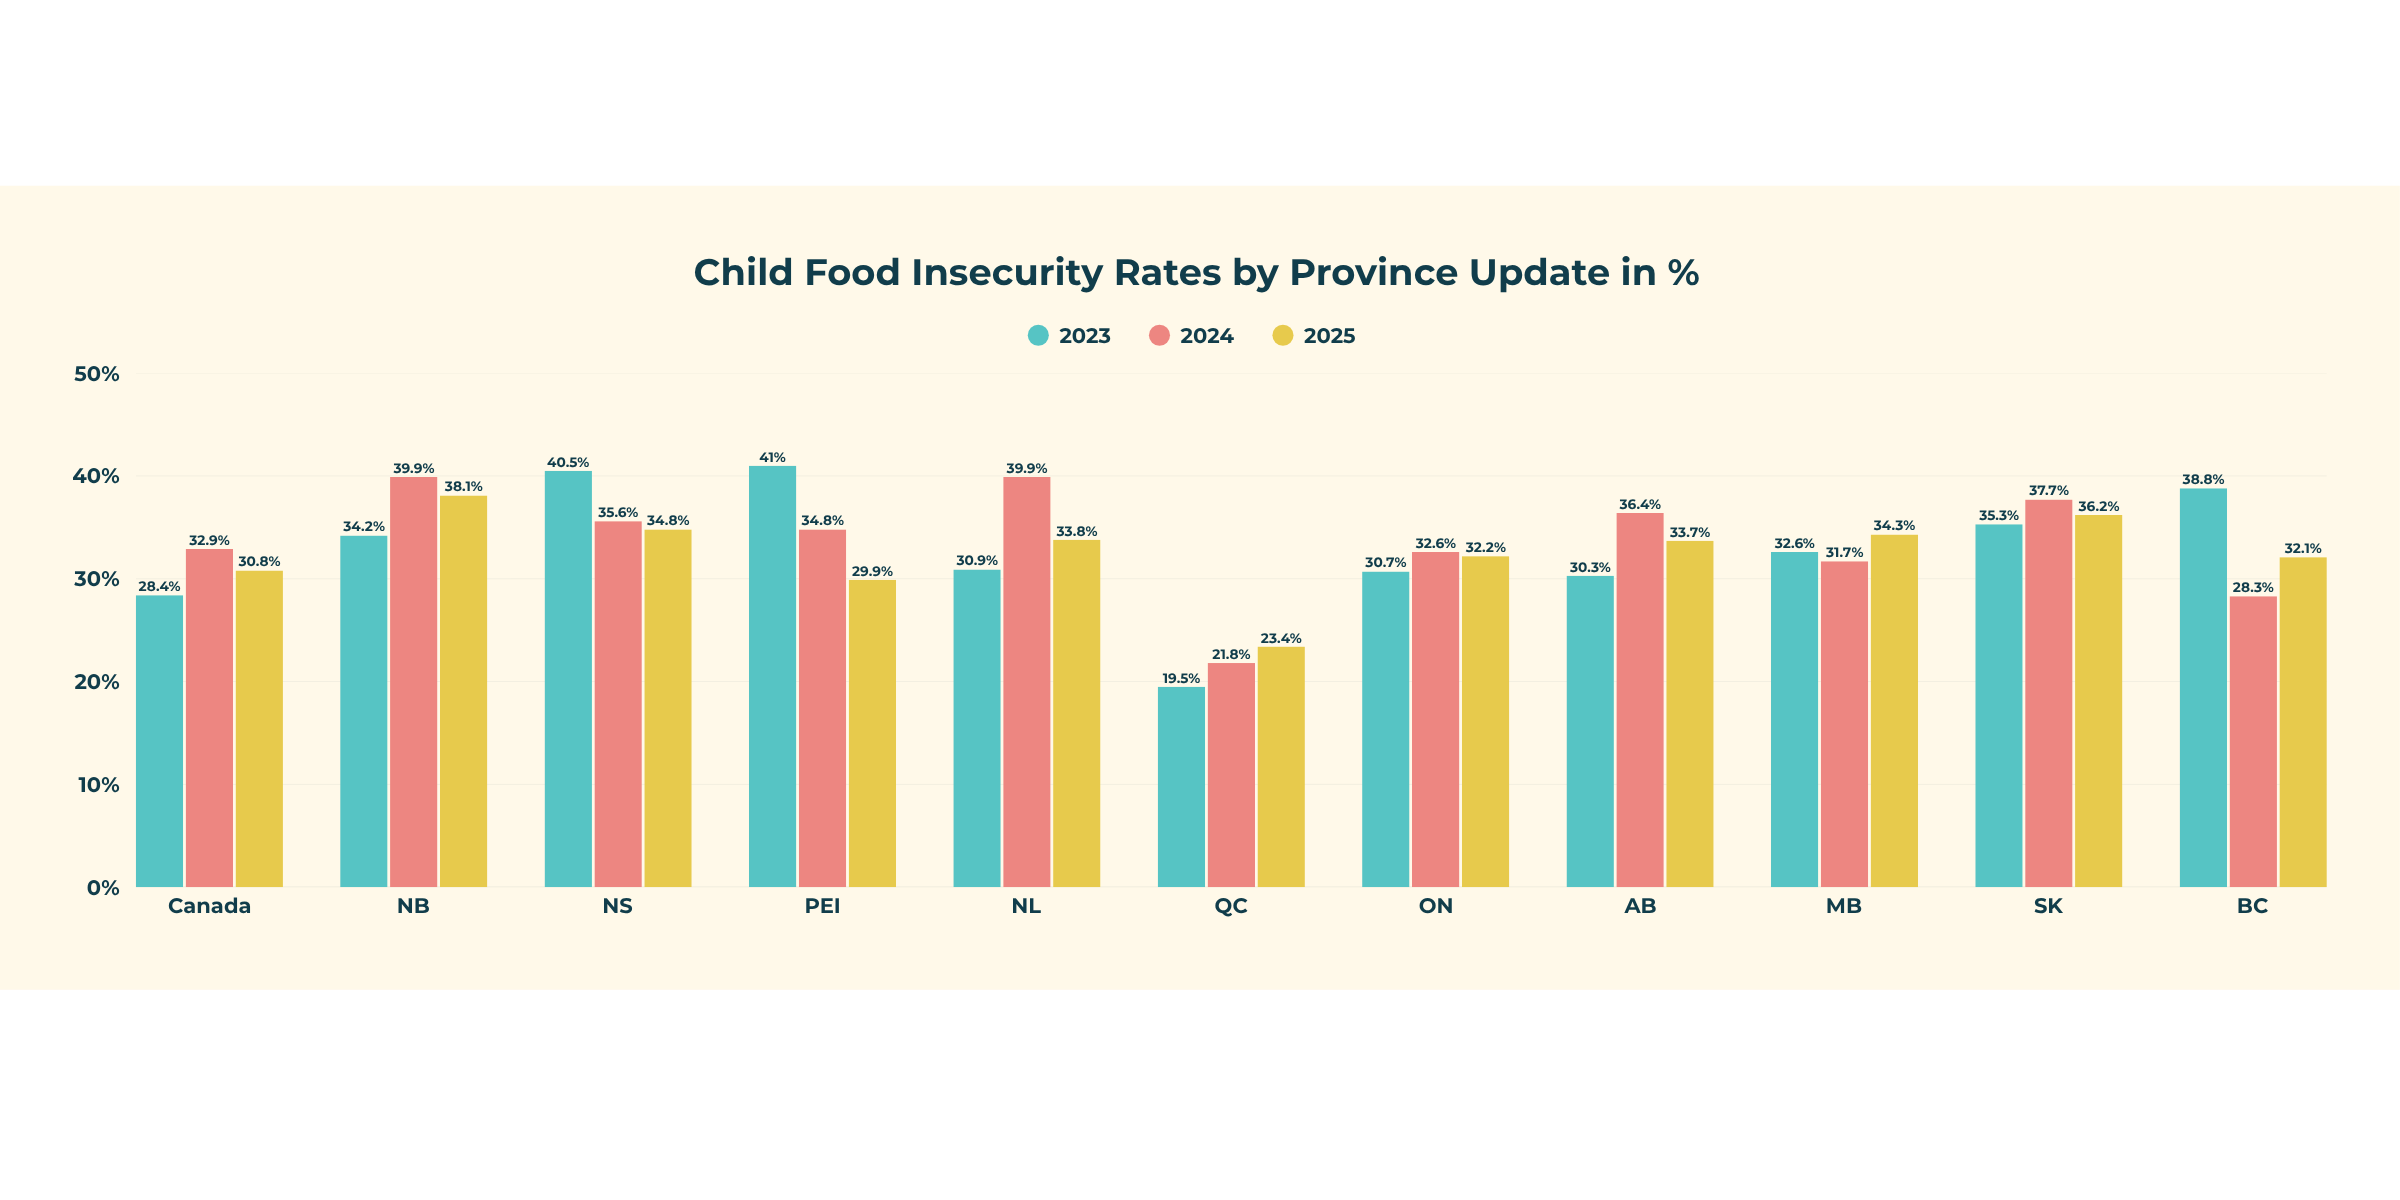
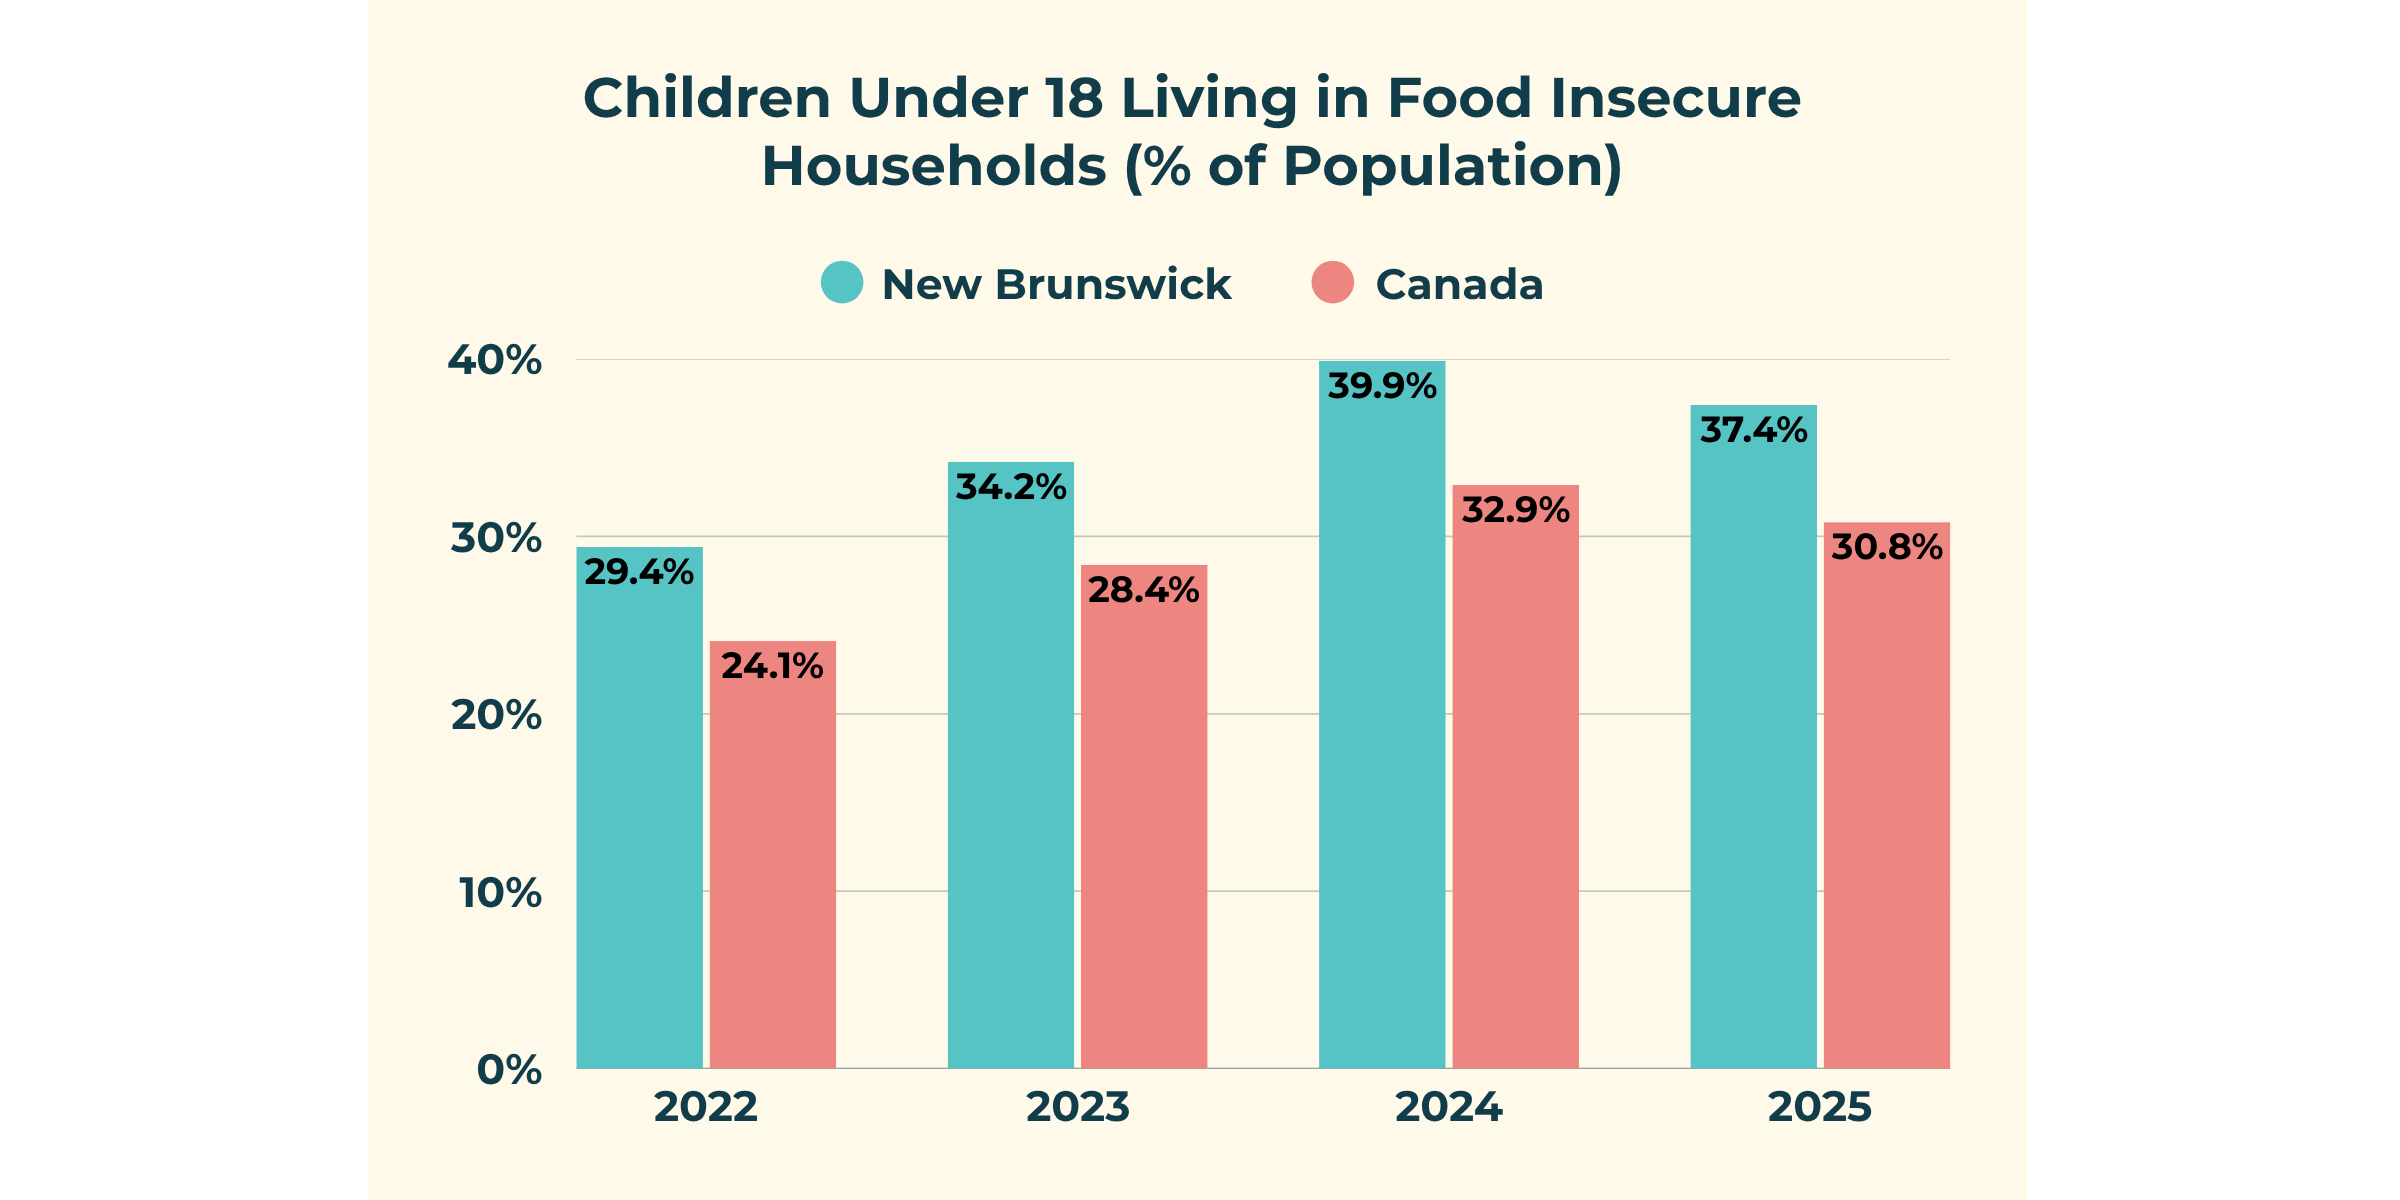
New Brunswick had one of the highest child food insecurity rates in Canada in 2024, with 39.9% of children living in food-insecure households.
The rate rose from roughly 1 in 4 children in 2021 to 2 in 5 children in 2024, placing New Brunswick among the provinces with the highest child food insecurity rates in Canada. Even with some improvement in 2025, more than one-third of New Brunswick children were still living in food-insecure households
The proportion of Canadian children living in food-insecure households increased from roughly one in five children before the pandemic to one in three children by 2024. Although there was a modest improvement in 2025, nearly 2.4 million children — 30.8% of all children in Canada — were still living in food-insecure households.
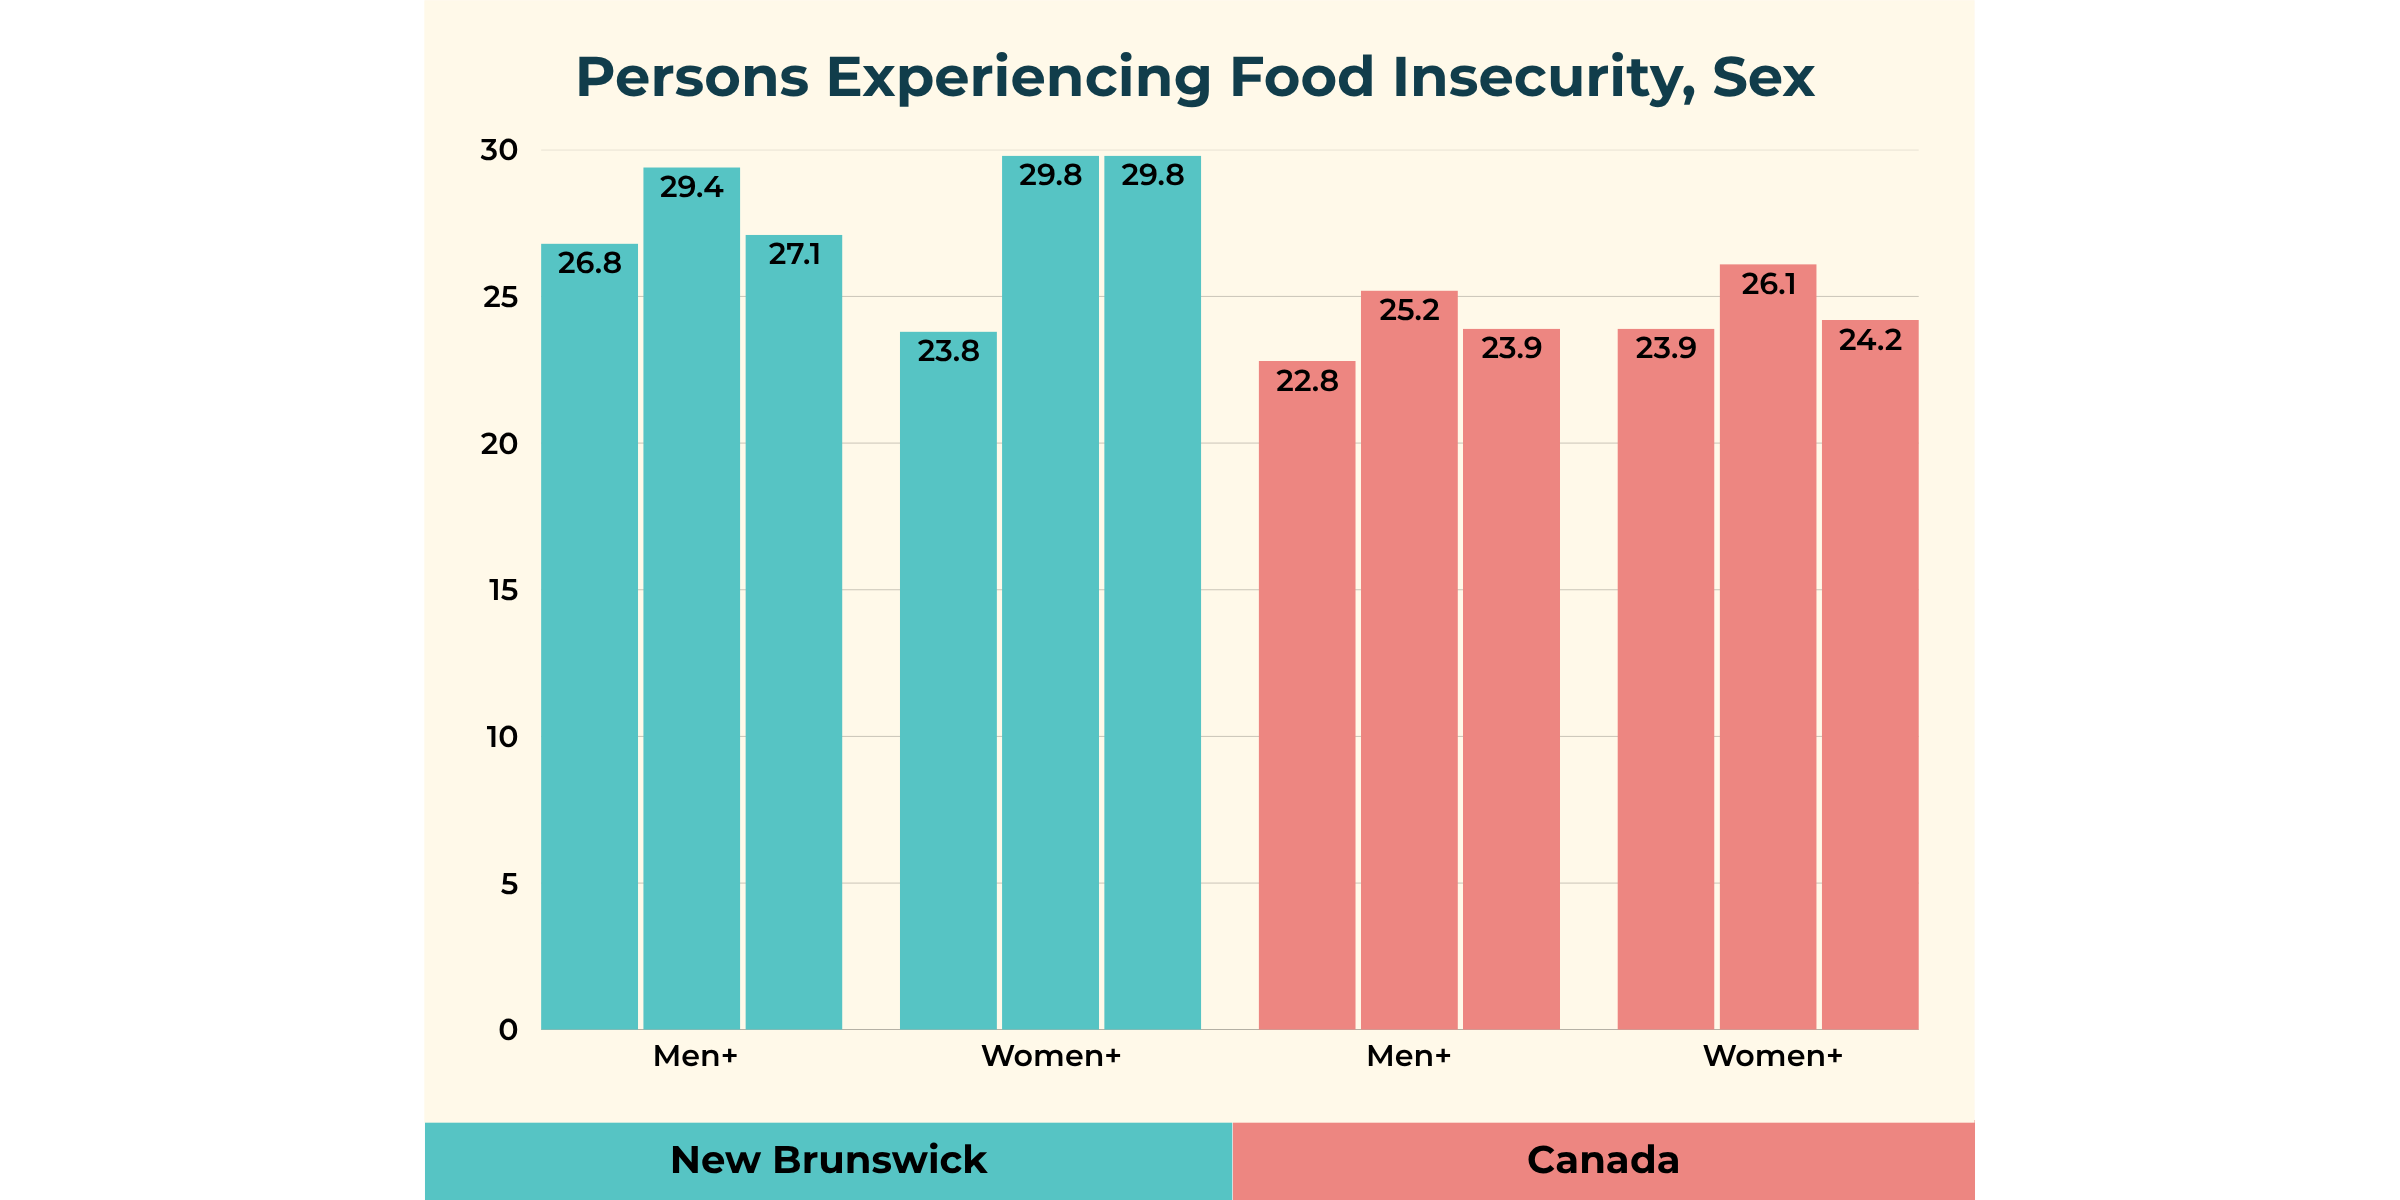
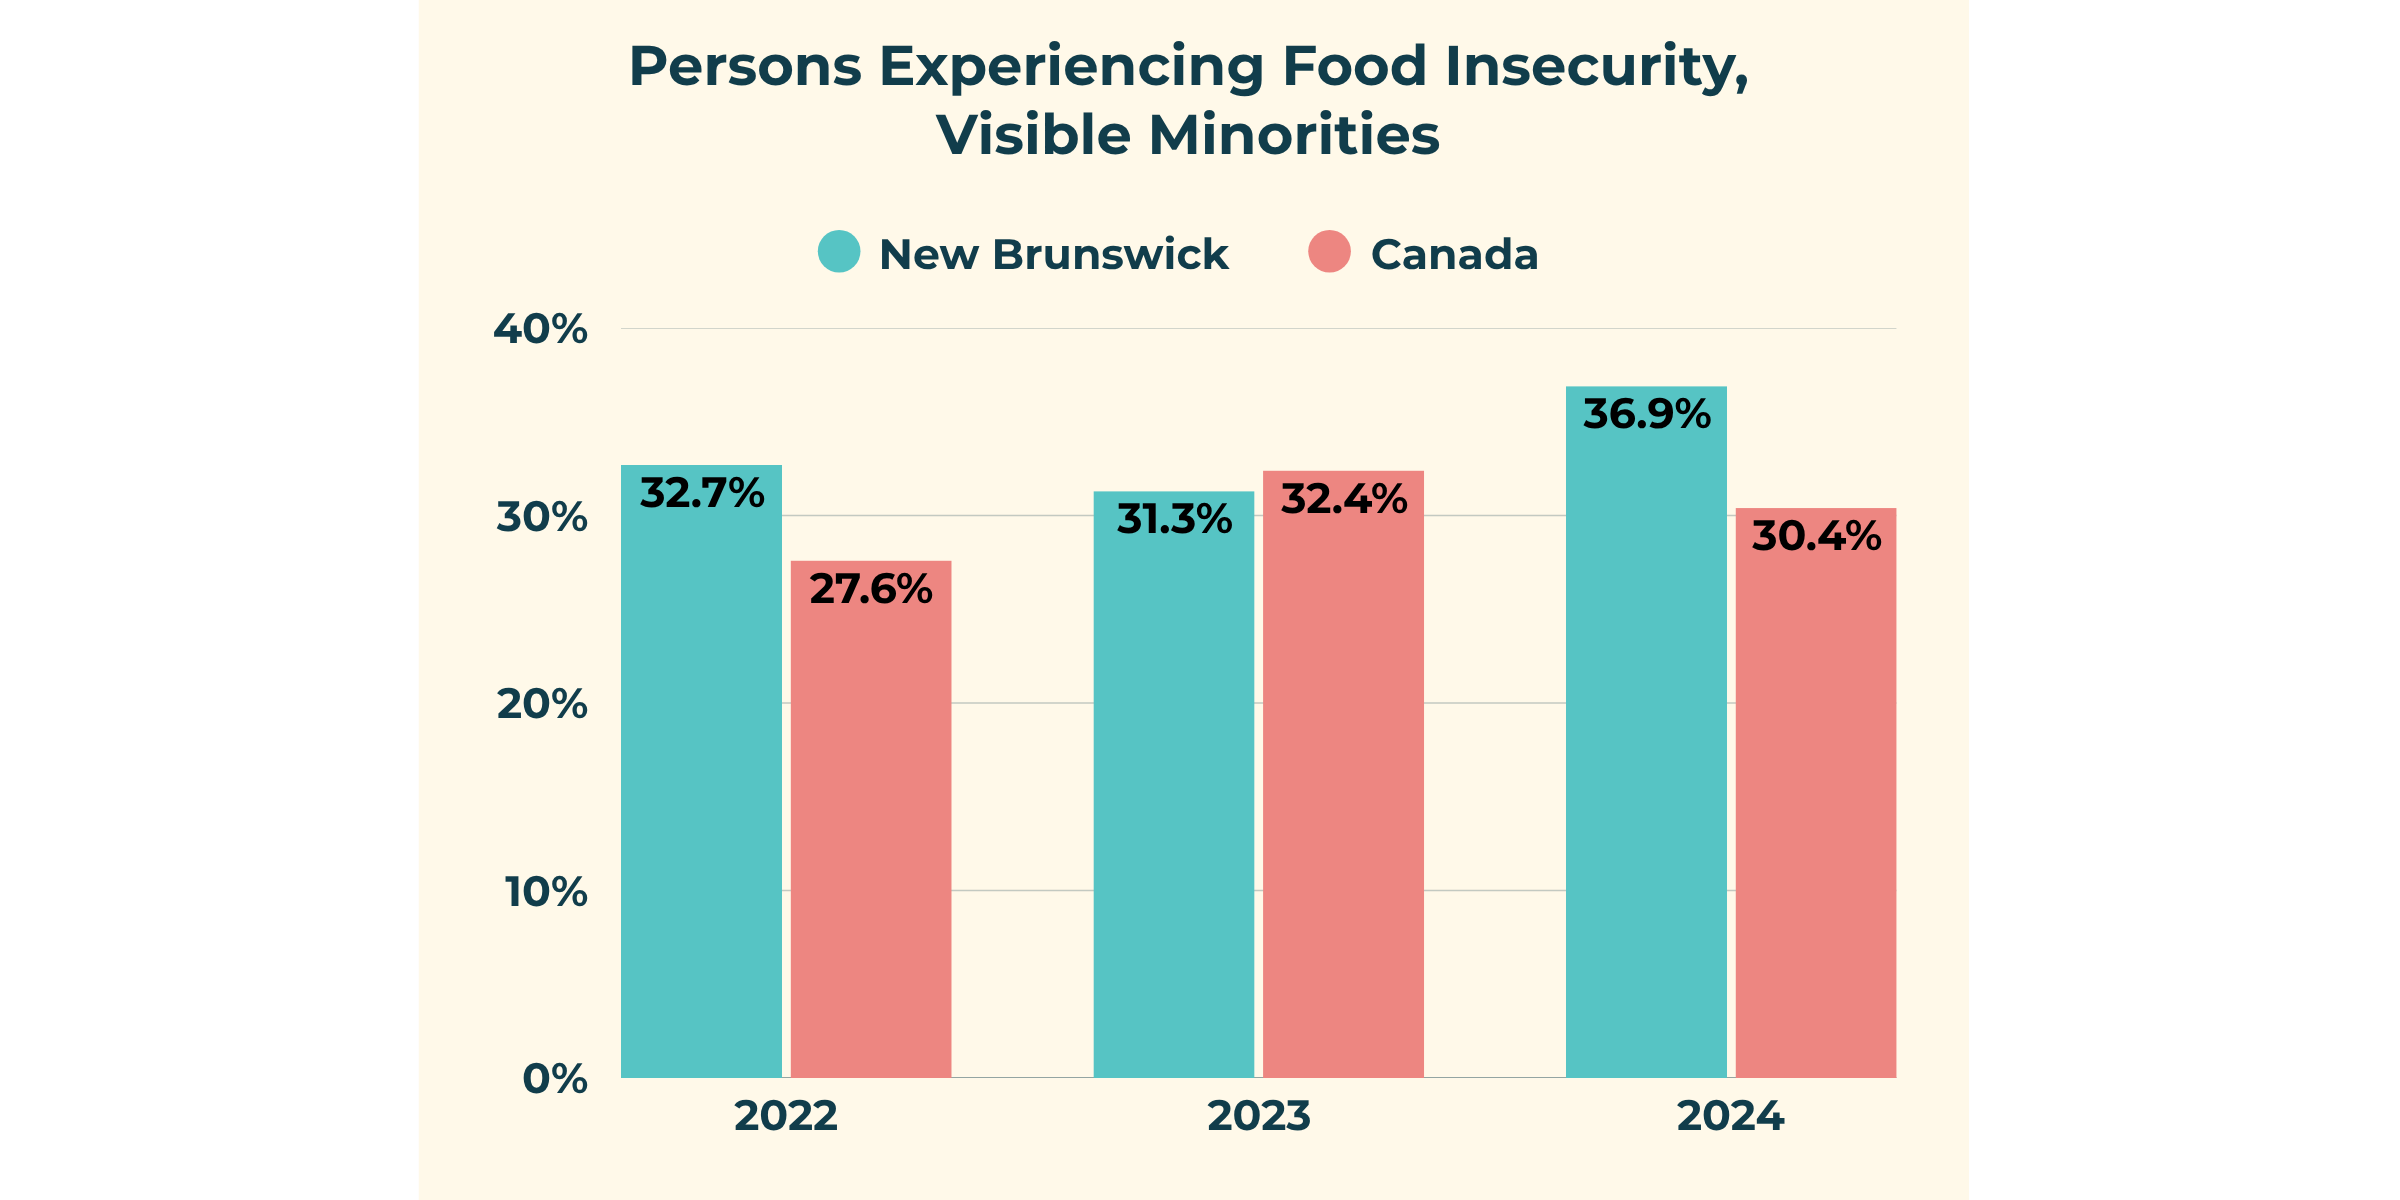
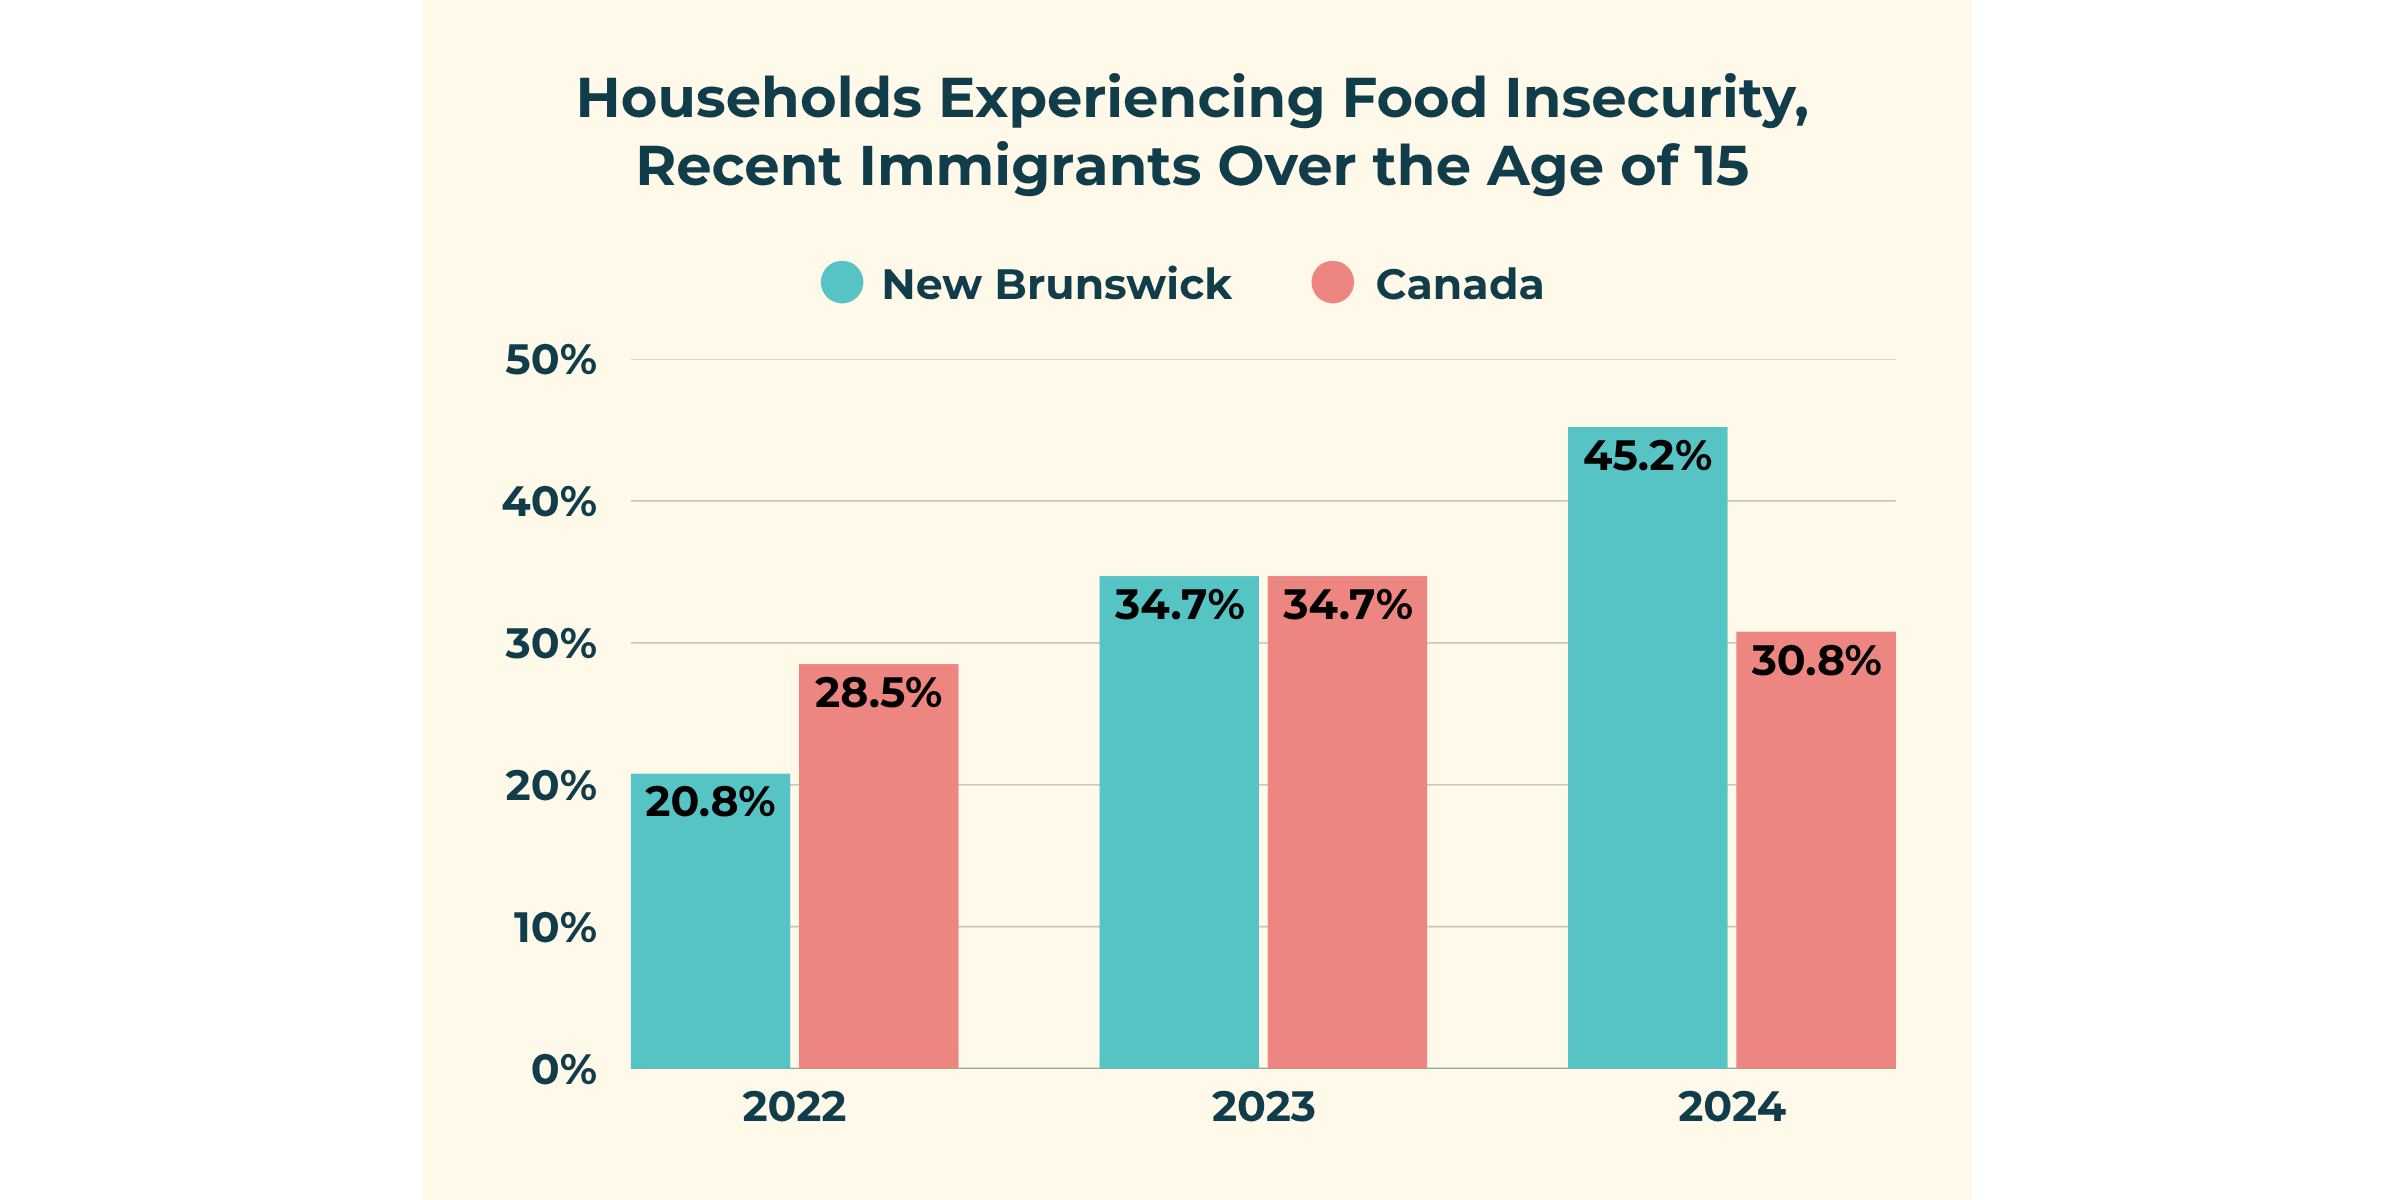
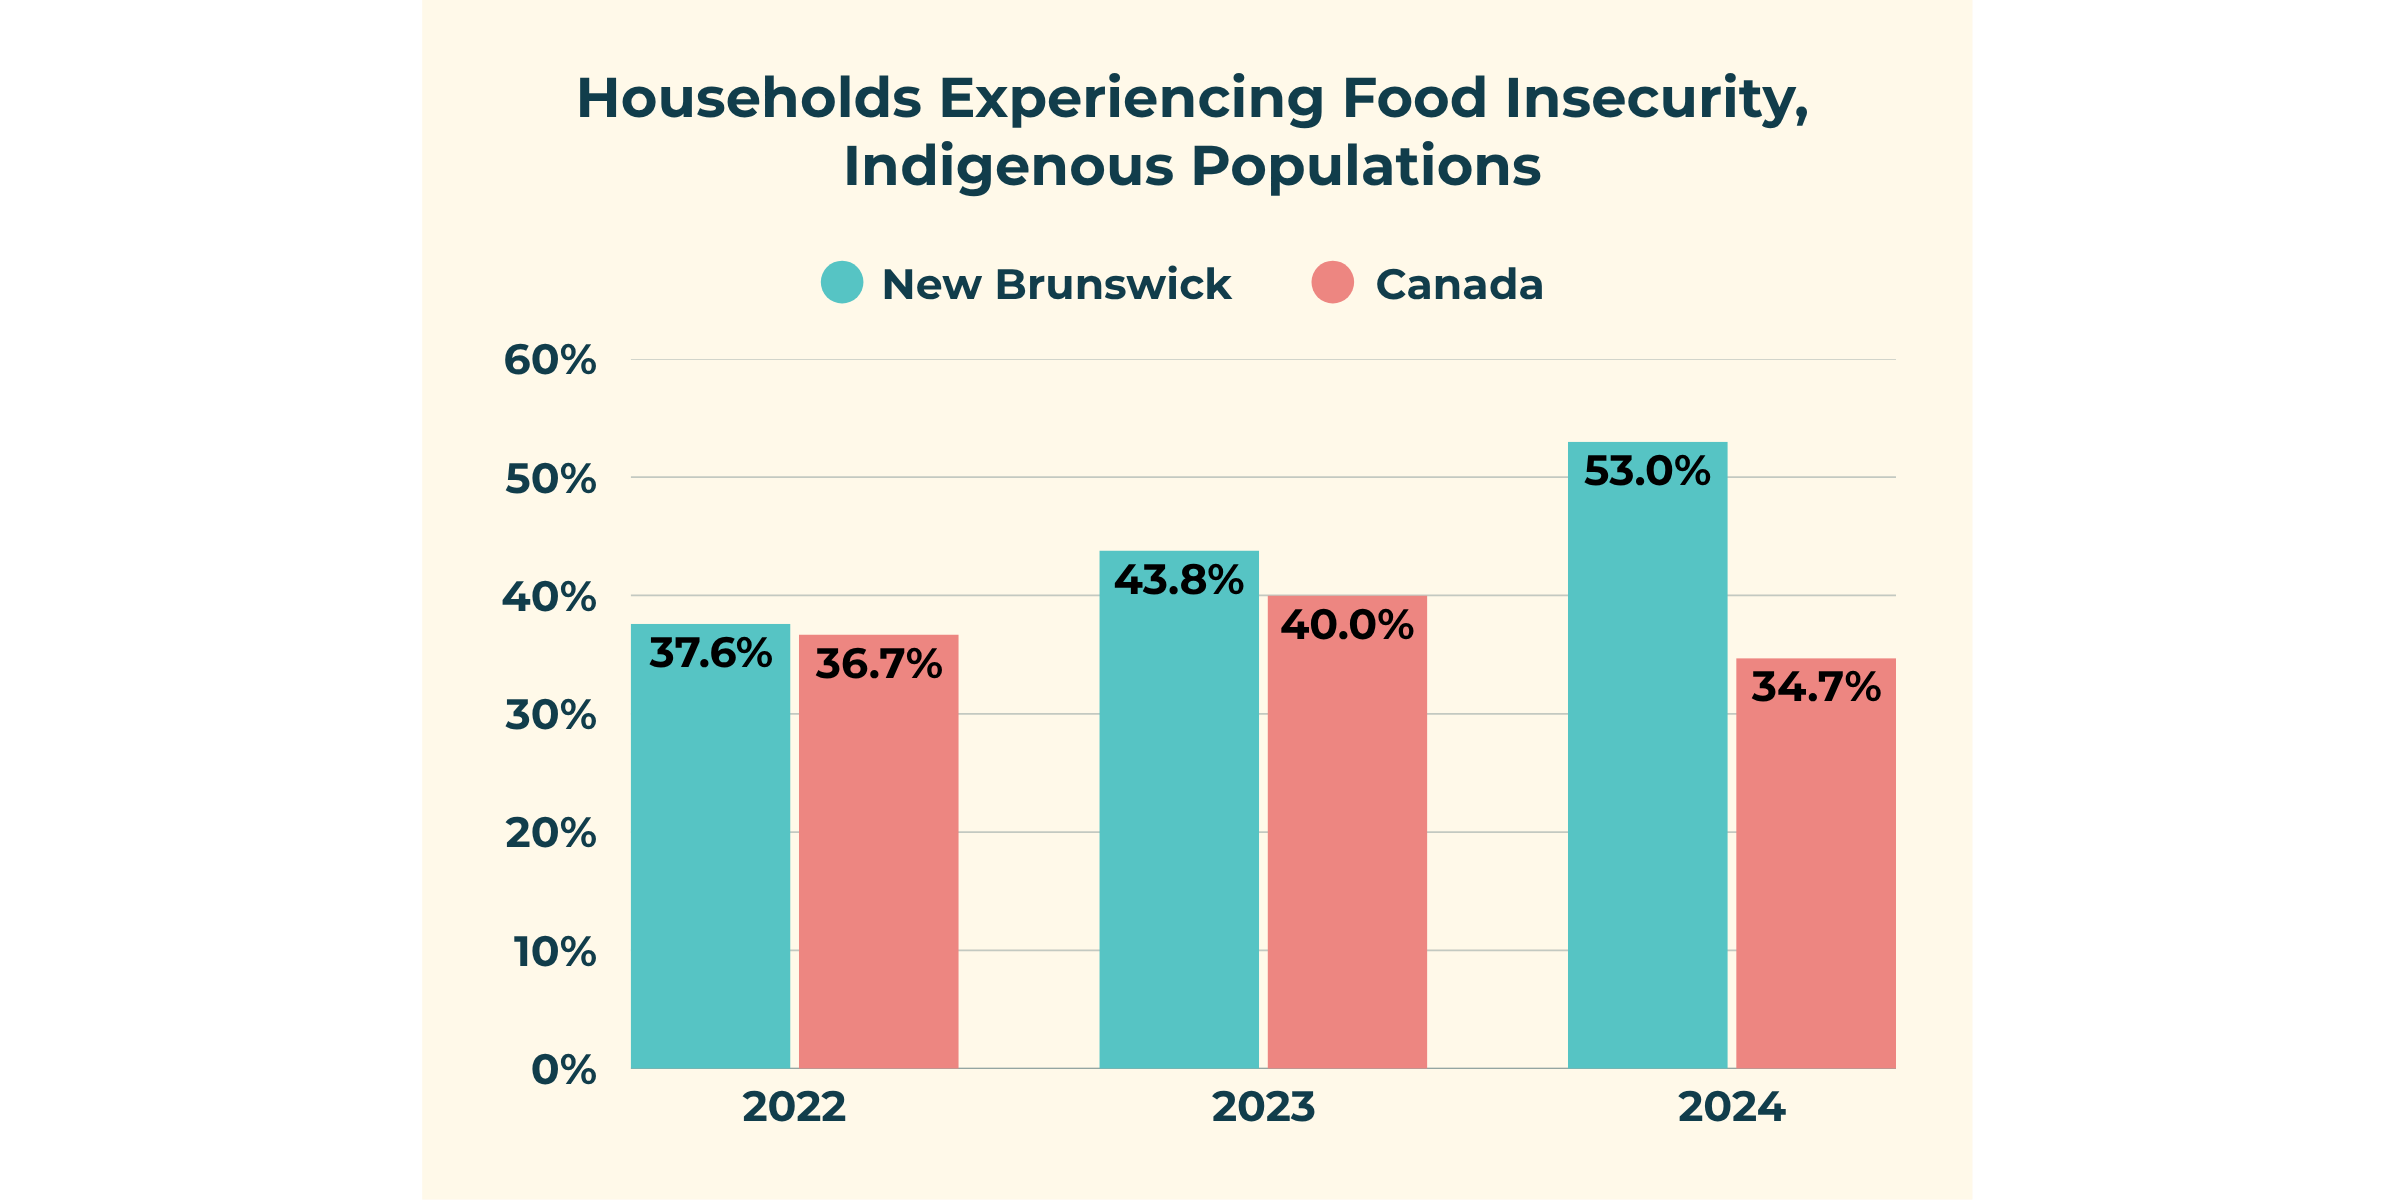
Food Insecurity Status - % of people living with food insecurity
Provincial Funding for School Food Programs
New Brunswick has committed approximately $27.4 million annually to universal school food programming, supplemented by $11.2 million in federal funding over three years, allowing breakfast programs to expand to every public school in the province.
Food Banks
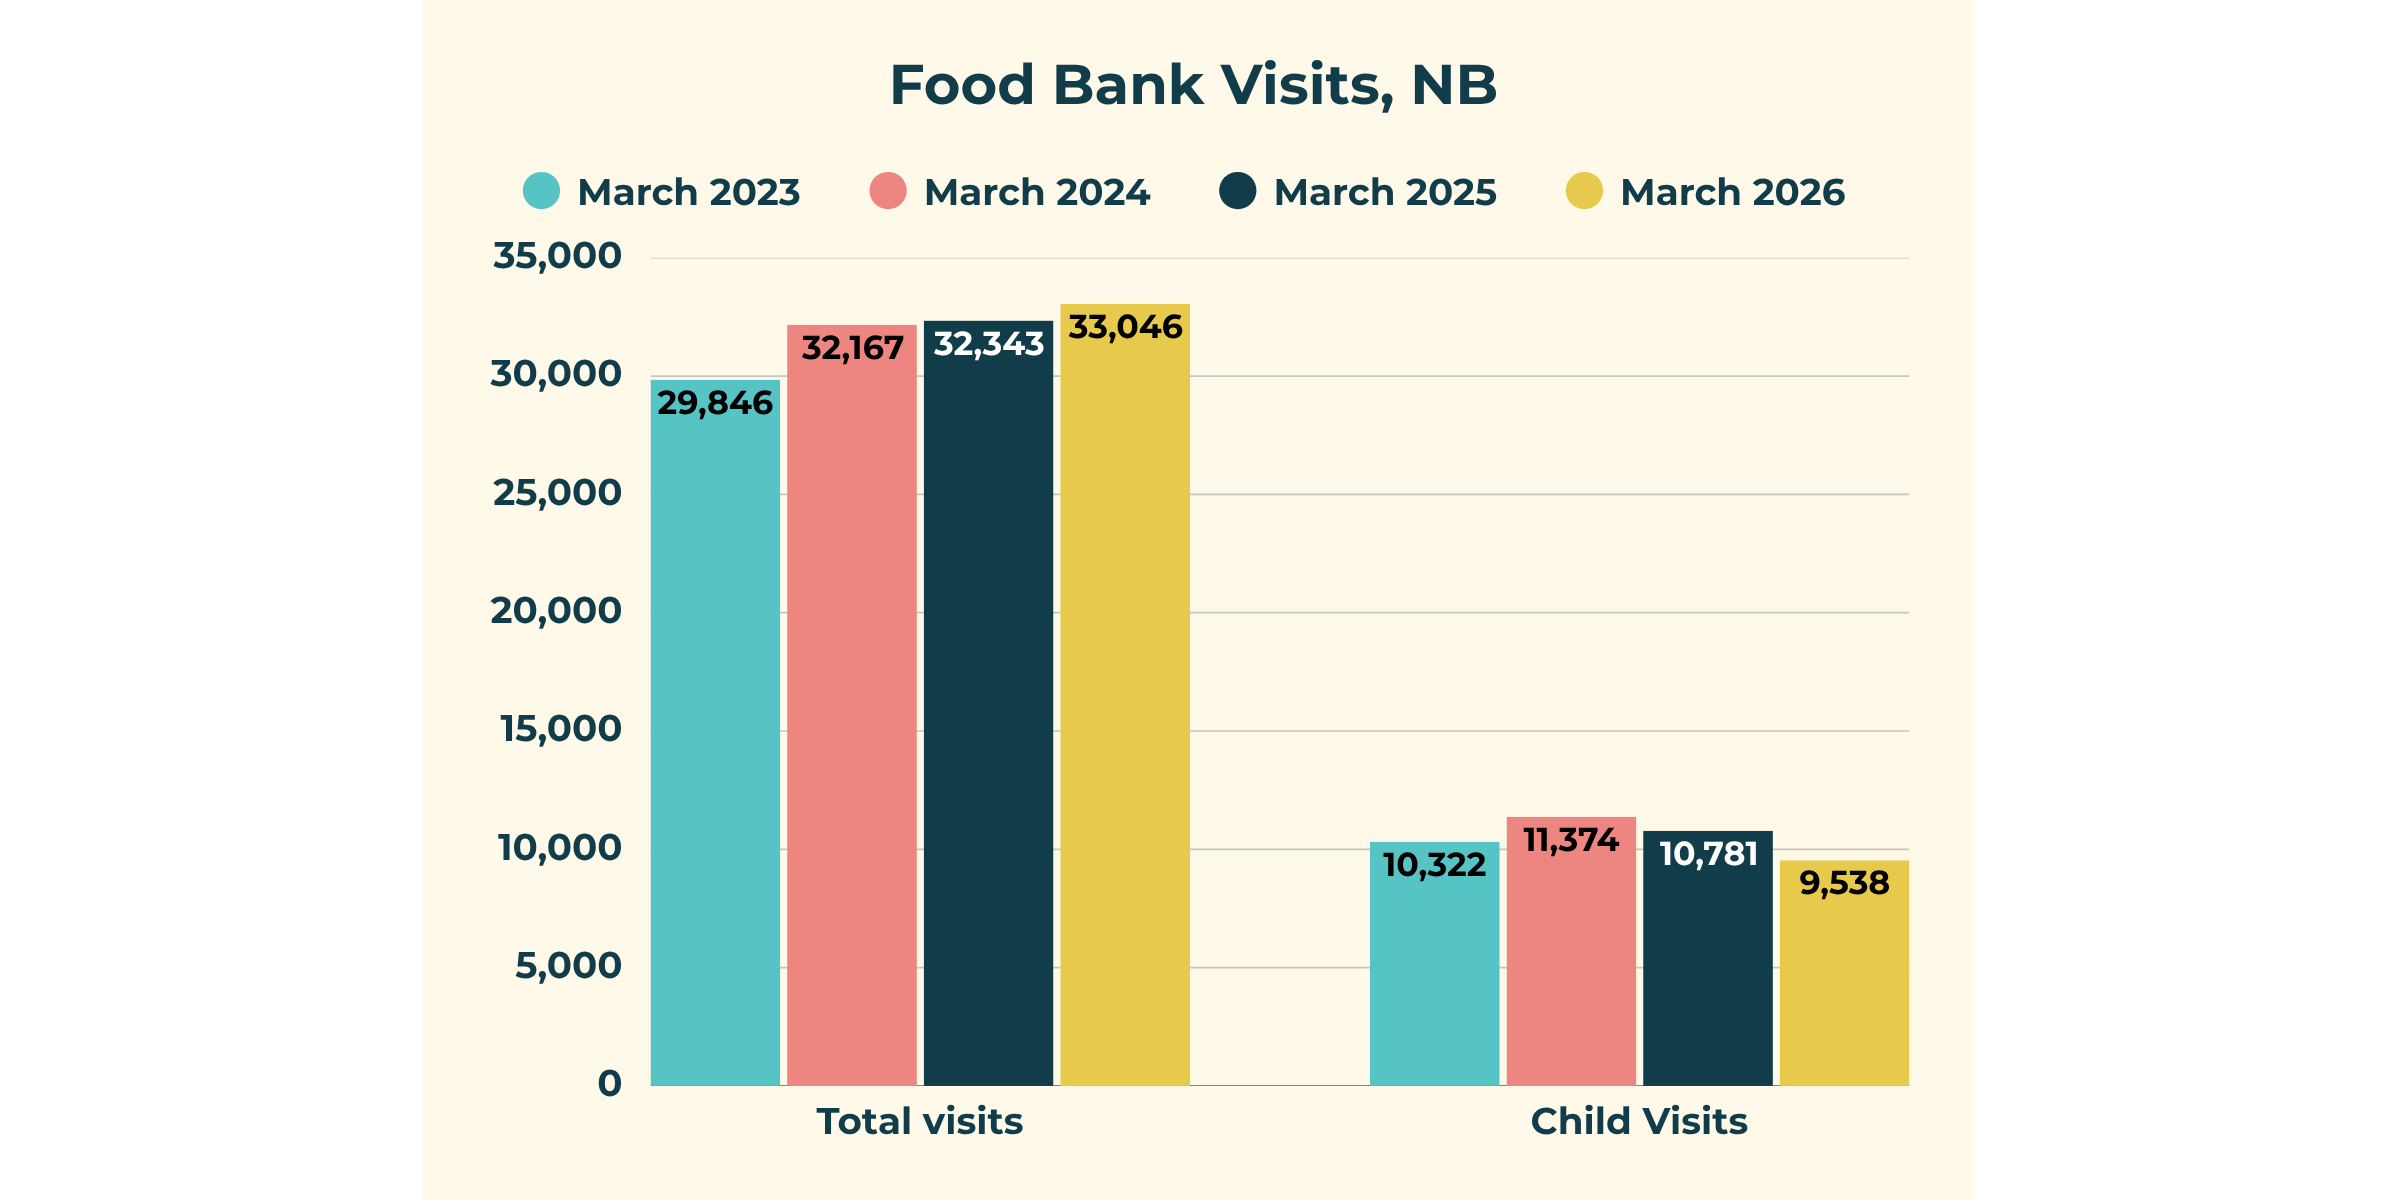
As of March 2026, NB food banks saw 33,046 visits, including 9,538 children. This represents an increase over last year.
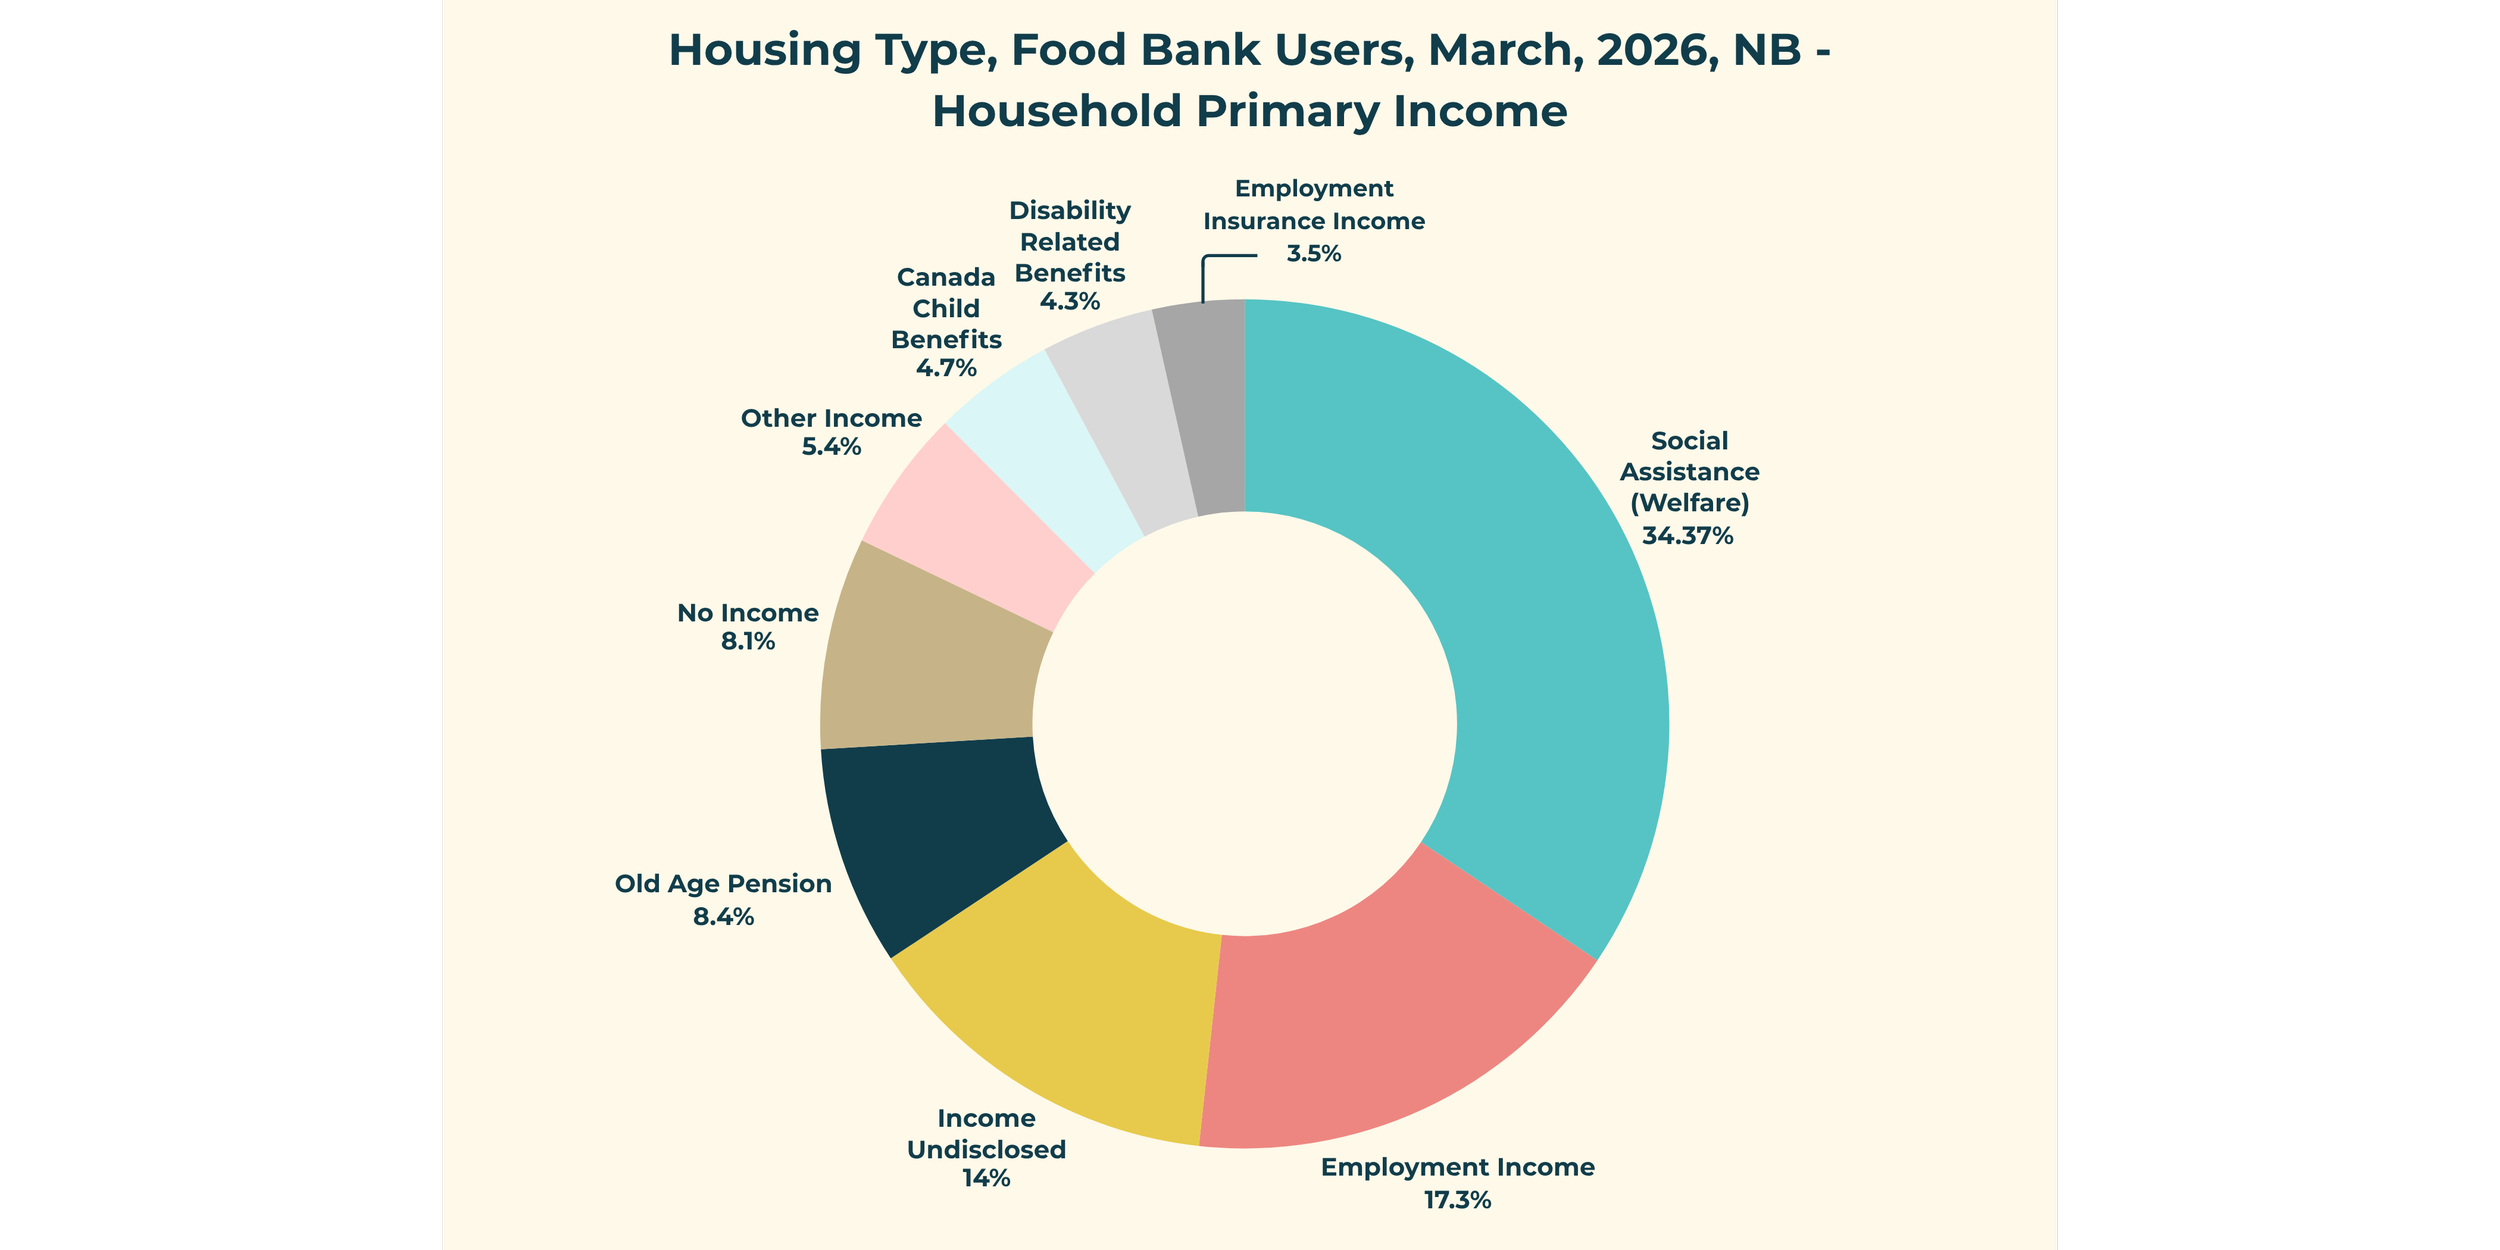
In 2025, approximately 34% of food bank users reported social assistance as their primary income while over 17% reported that employment is their main source of income.
In Canada, nearly 1 in 5 food bank clients were employed in 2025, compared to 1 in 10 in 2019. This is the highest proportion of employed food bank clients ever recorded across Canada.
12.2% of food bank clients nationally receive provincial disability support.
40% of food bank clients in Canada are receiving social assistance or disability-related supports.
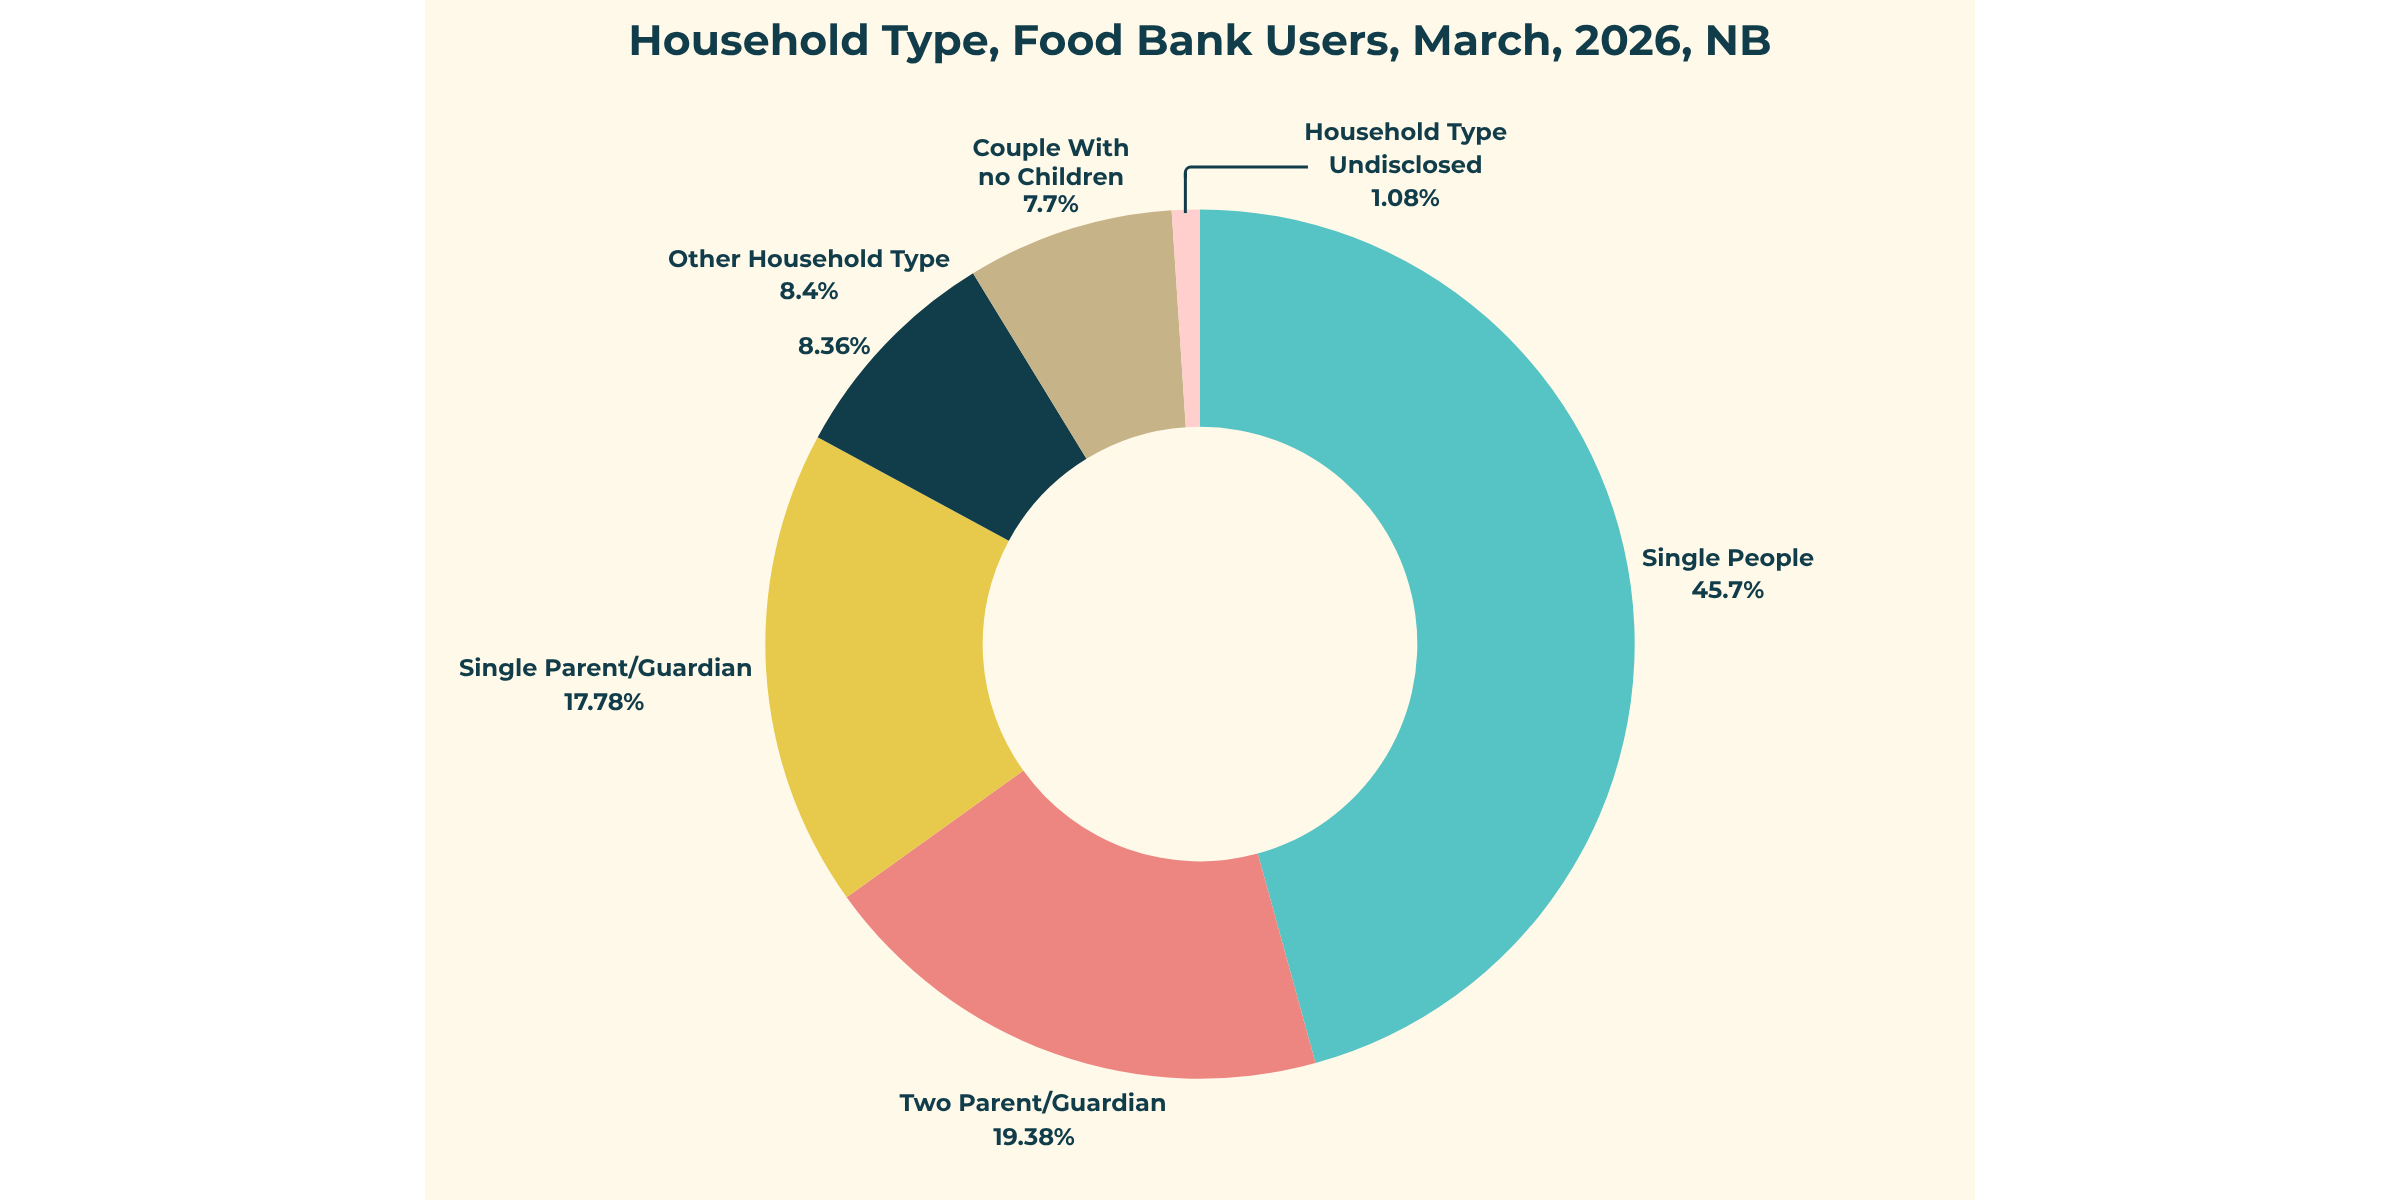
Across Canada, single-person households remain the most common household type accessing food banks.
The number of two-parent families with children accessing food banks continues to grow (by 4% nationally).
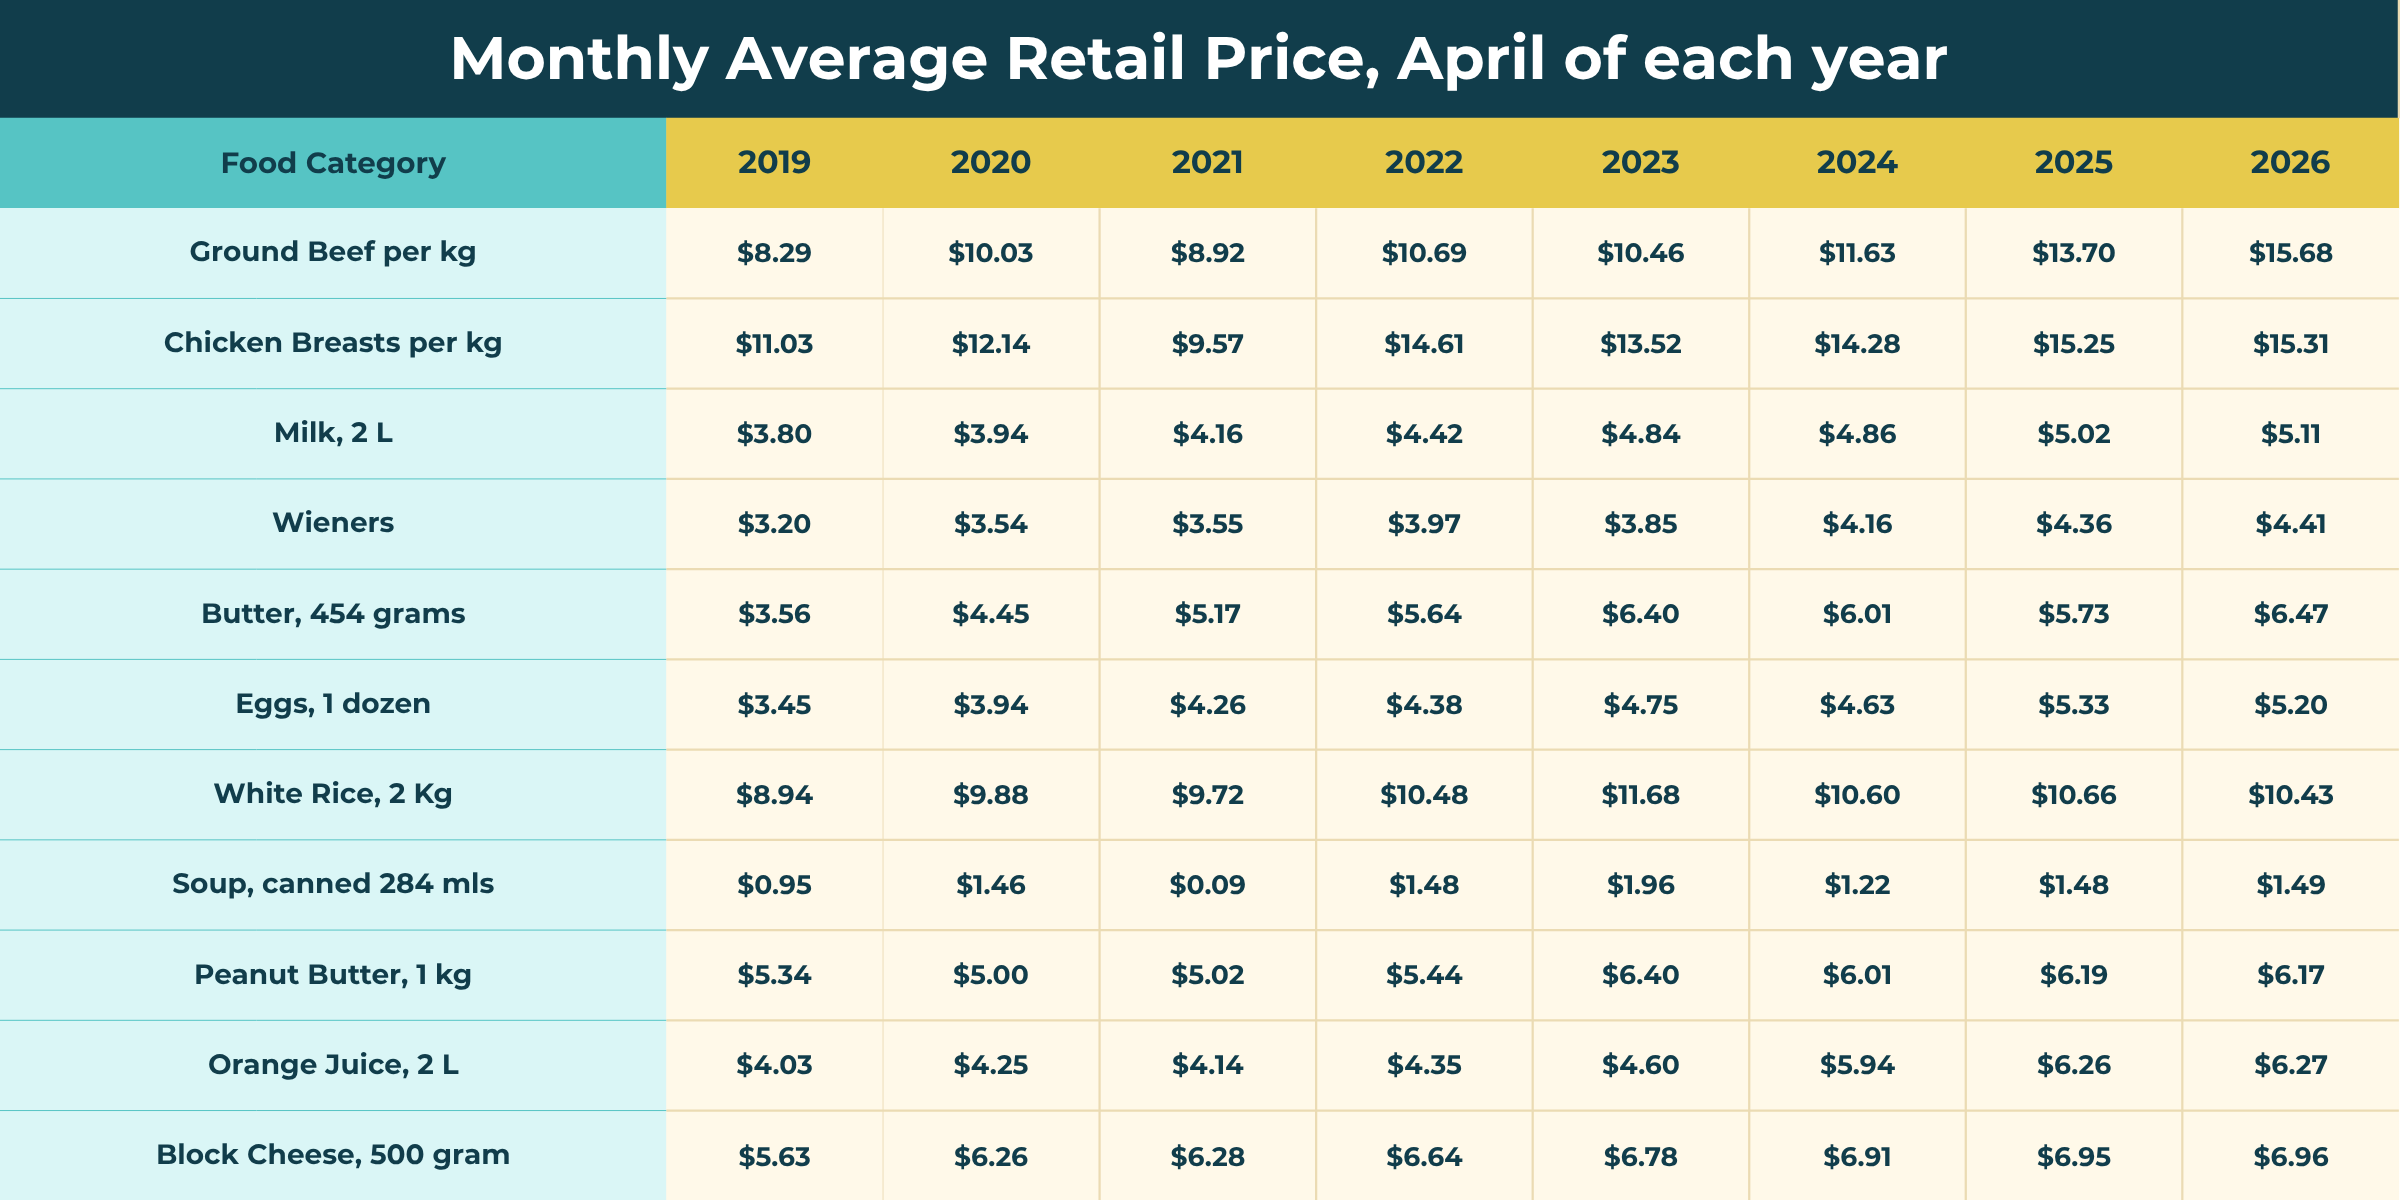
Where Does This Tie Into Food Insecurity?
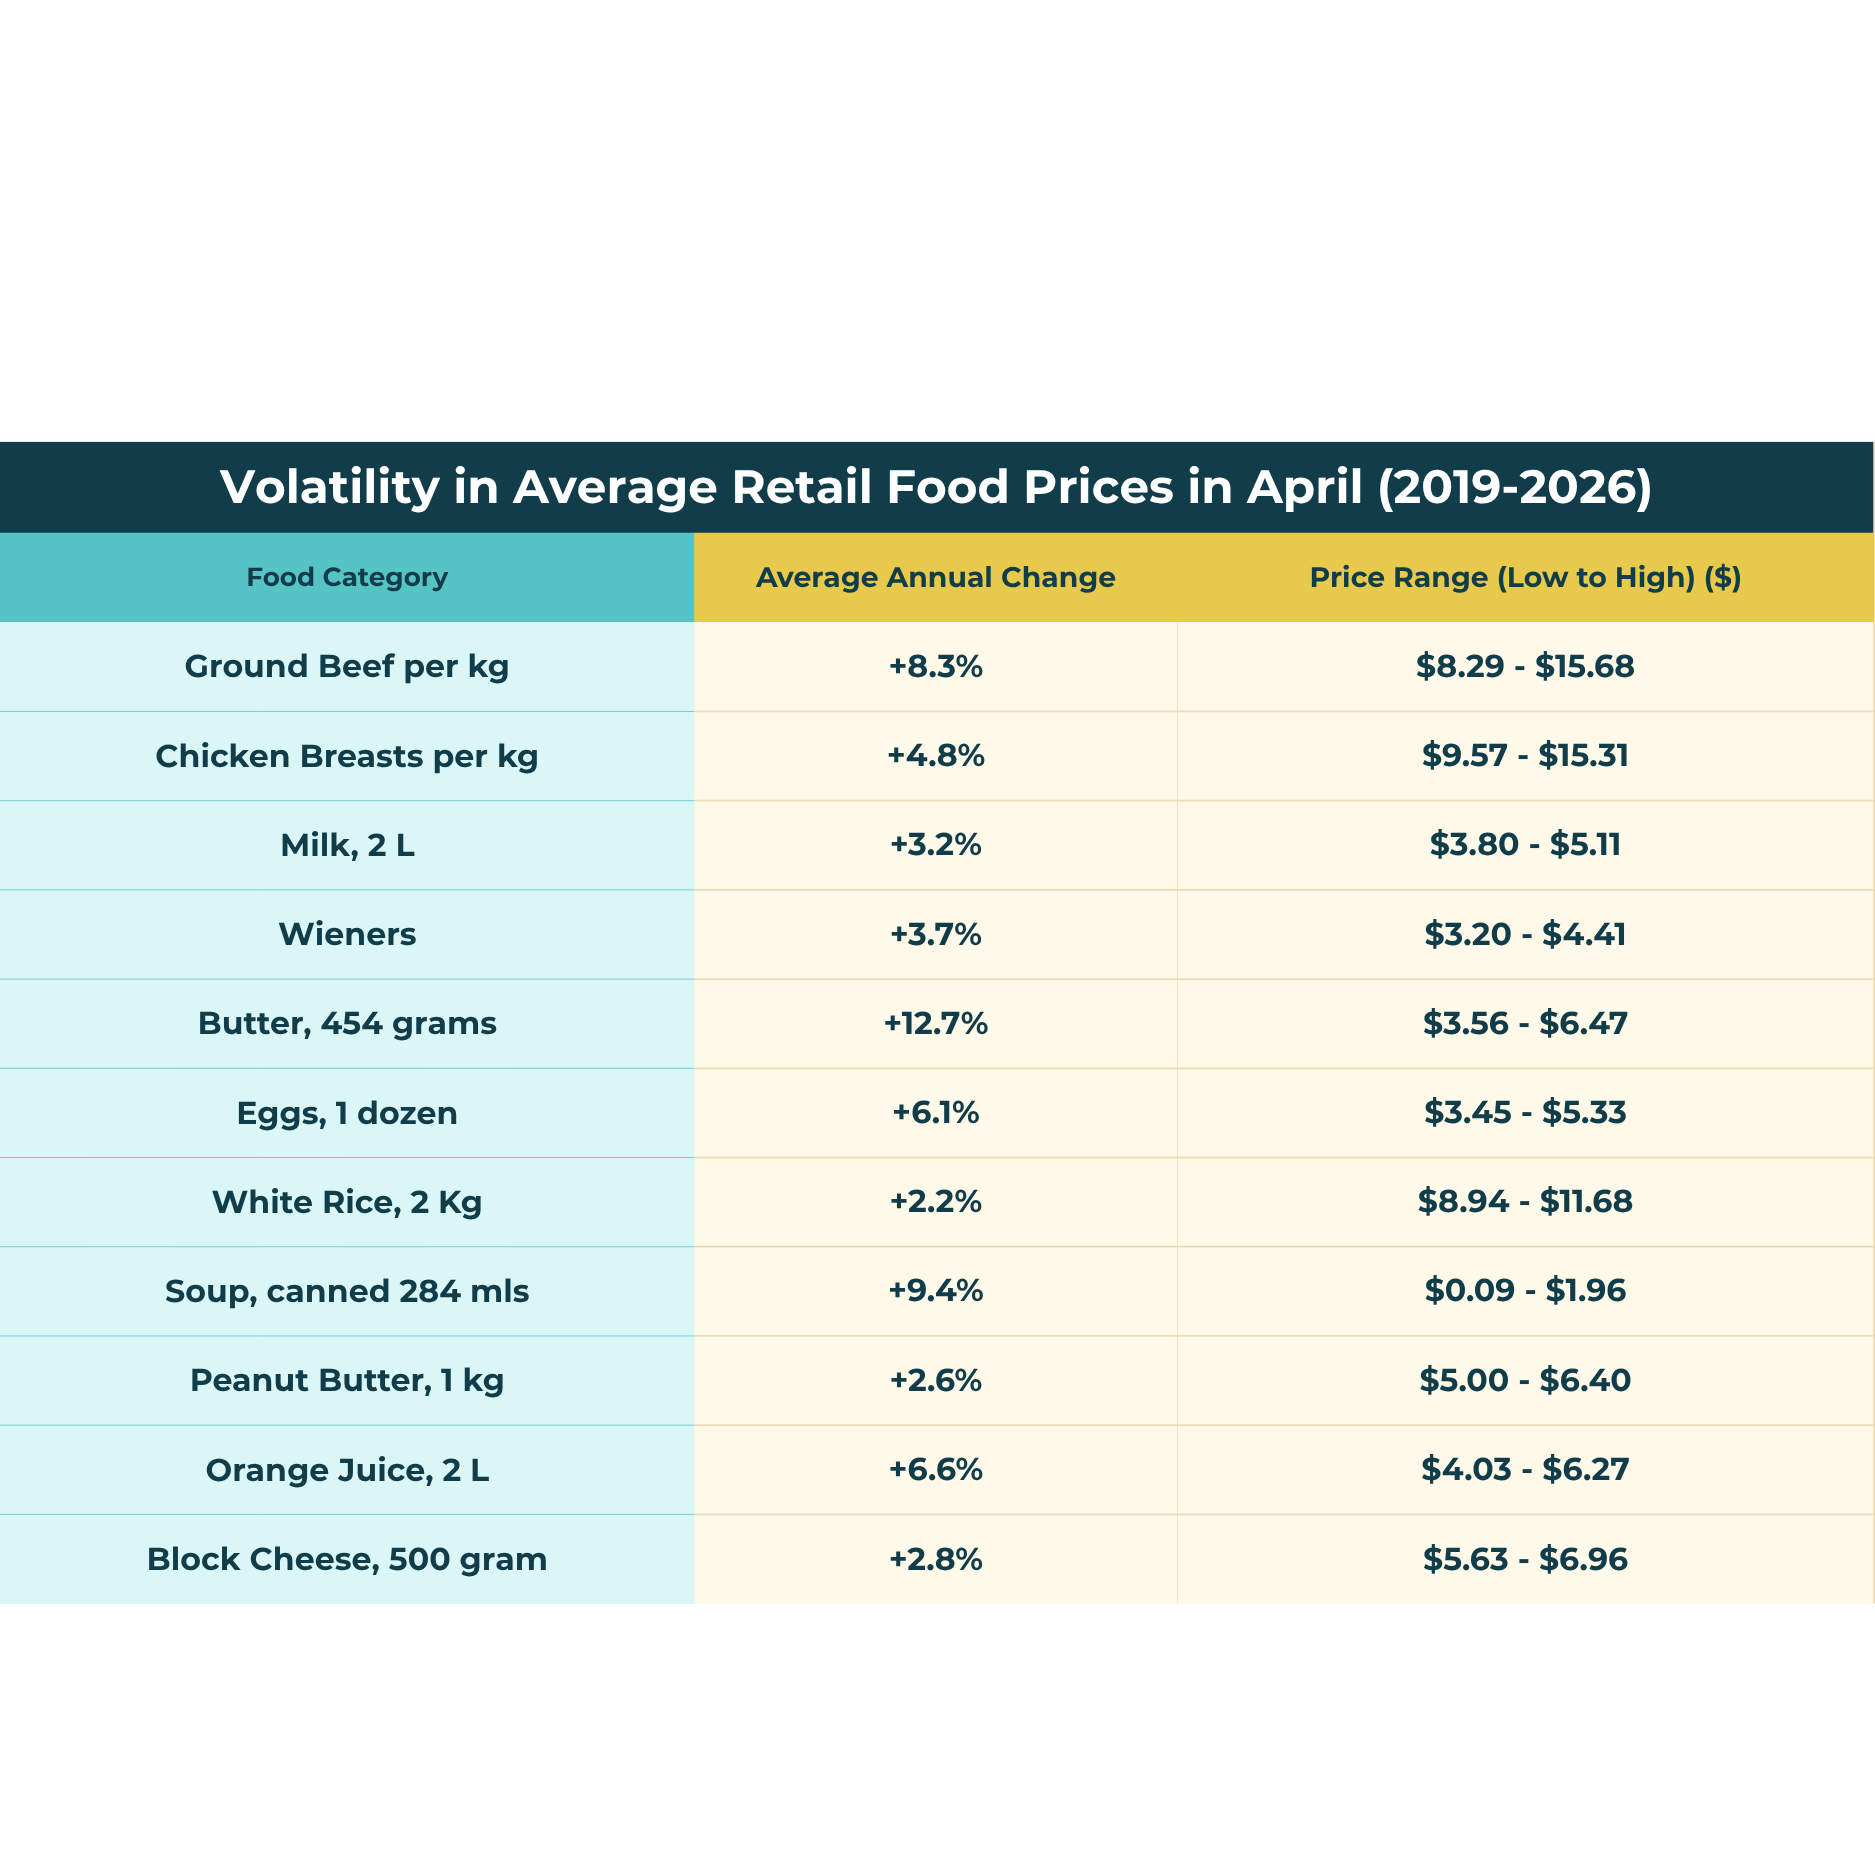
Average retail food prices have increased significantly over the past several years, with periods of considerable volatility that made grocery costs less predictable for households.
While price increases have recently begun to slow and food prices are showing signs of greater stability, overall costs remain much higher than previous levels. These elevated prices continue to strain household budgets, particularly for low-income individuals and families, making it more difficulty to afford adequate and nutritious food and increasing the risk of food insecurity.

Transportation
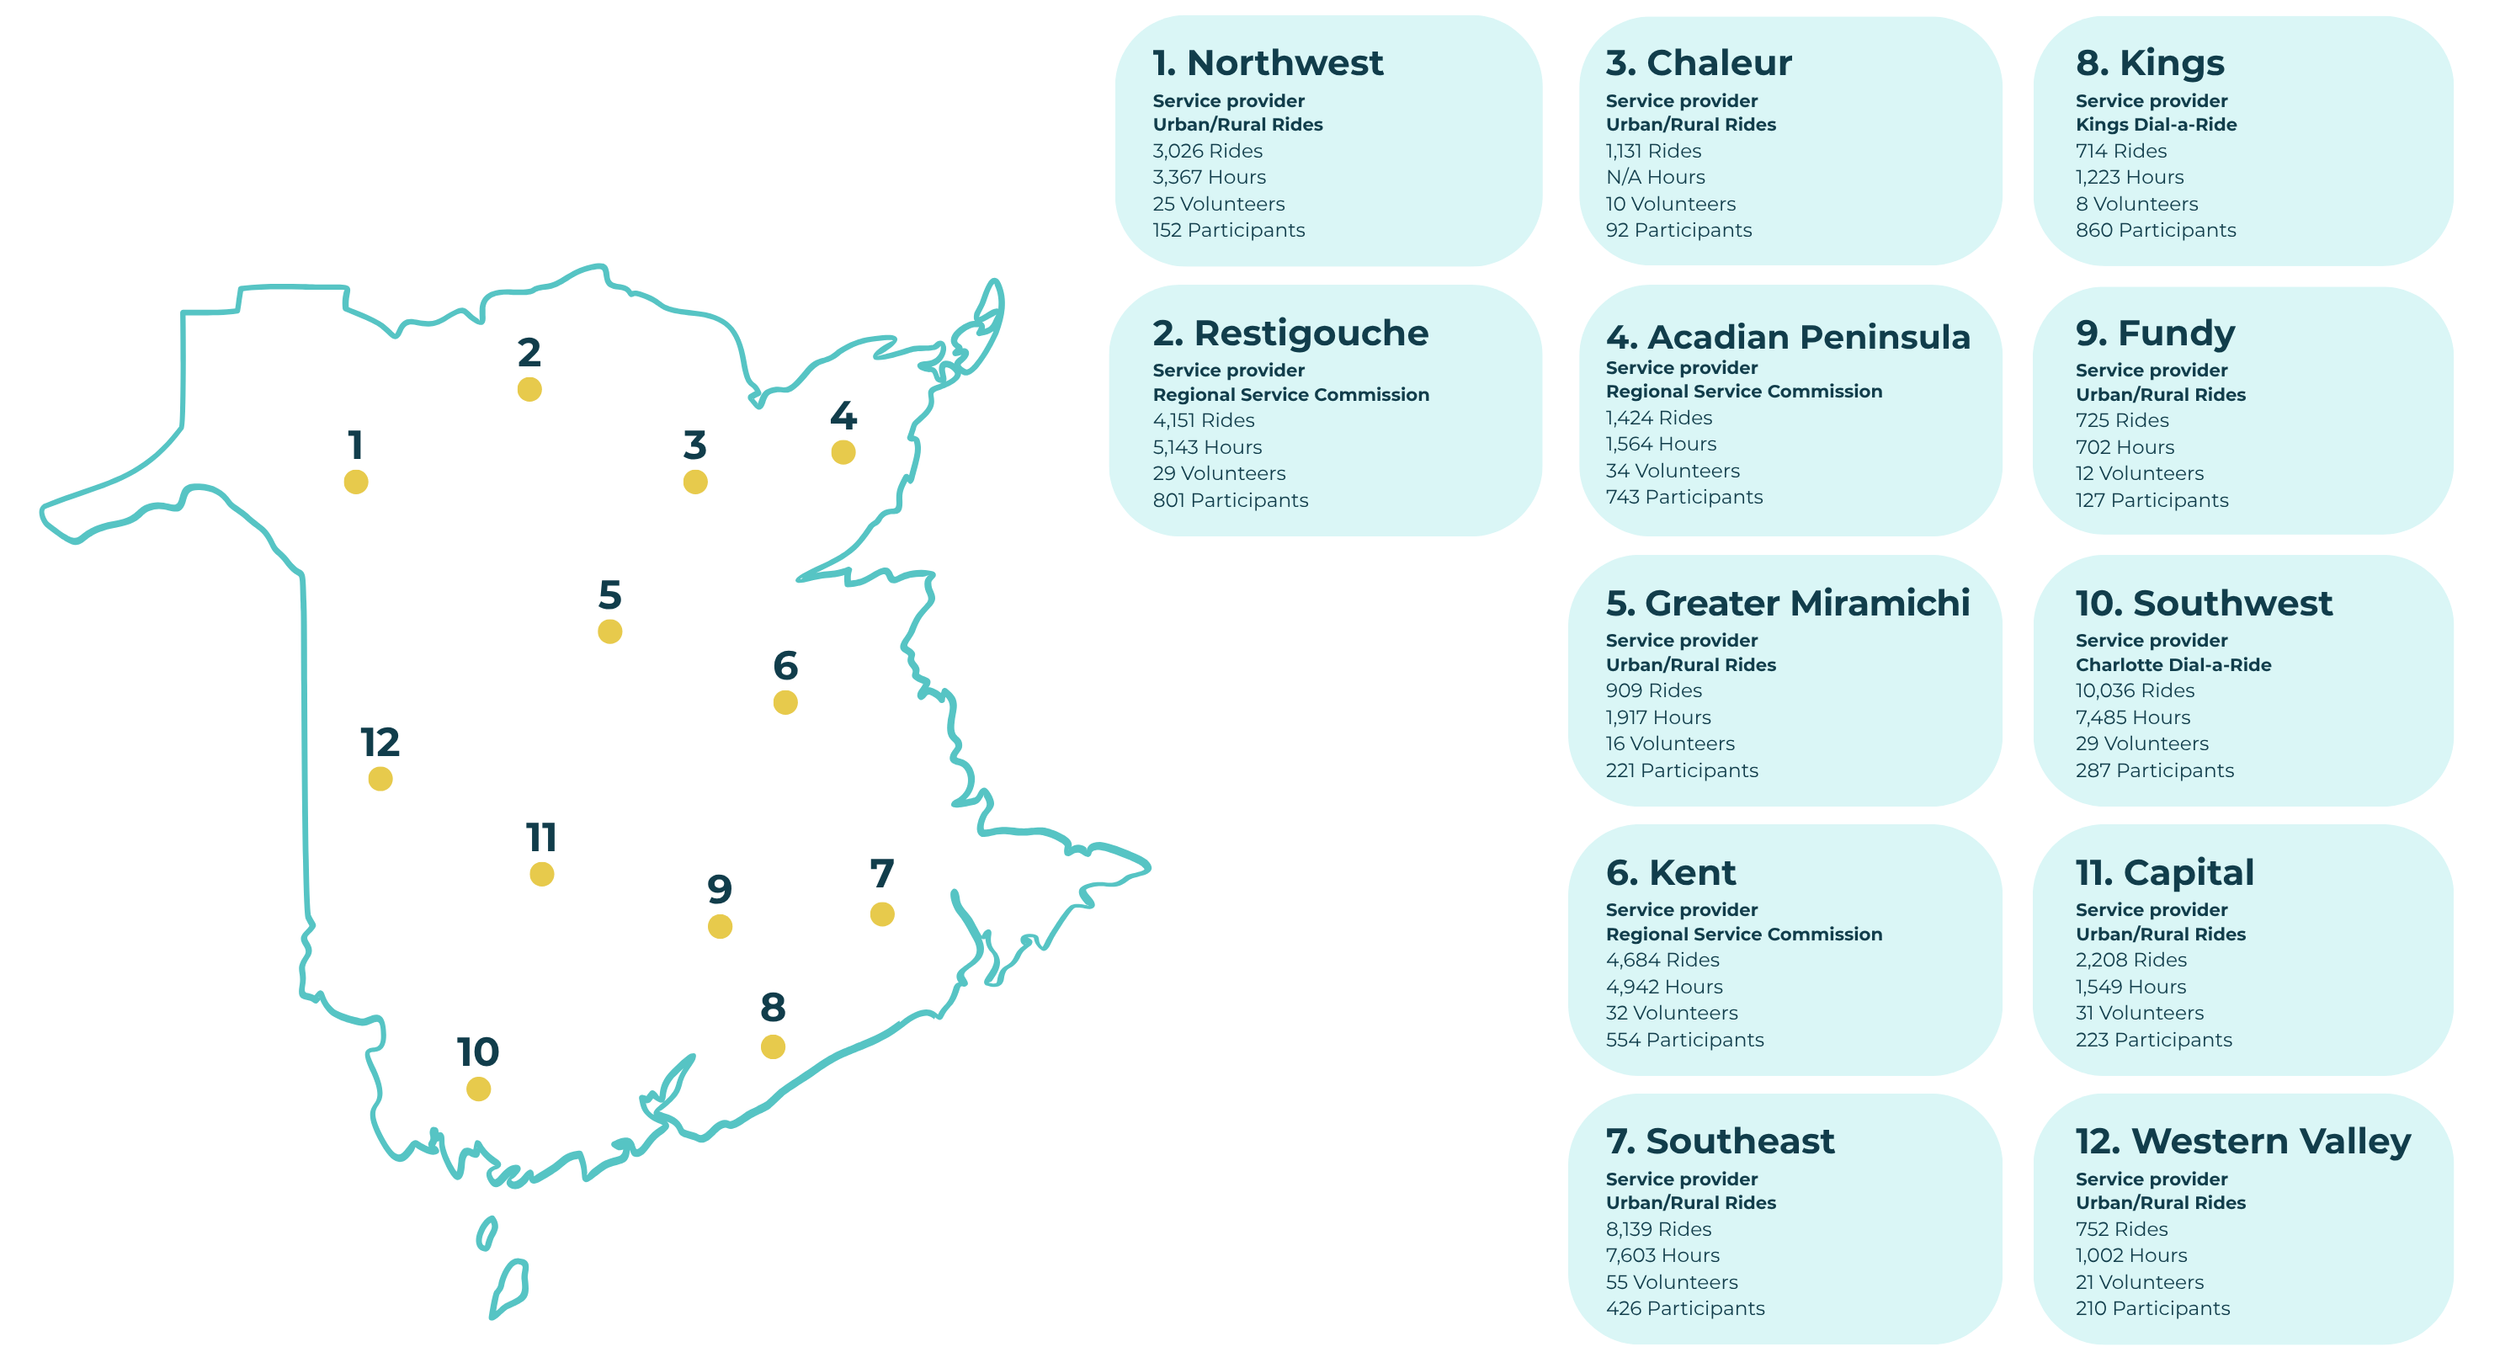
Accessible and reliable transportation is a key piece to fighting poverty, as it directly impacts access to jobs, healthcare, education, and other essential services. Community transportation in particular offers a vital starting point, helping to bridge the gap by providing affordable and reliable options for those facing transportation as a major barrier.
Community Transportation by Region Fiscal 2024-2025
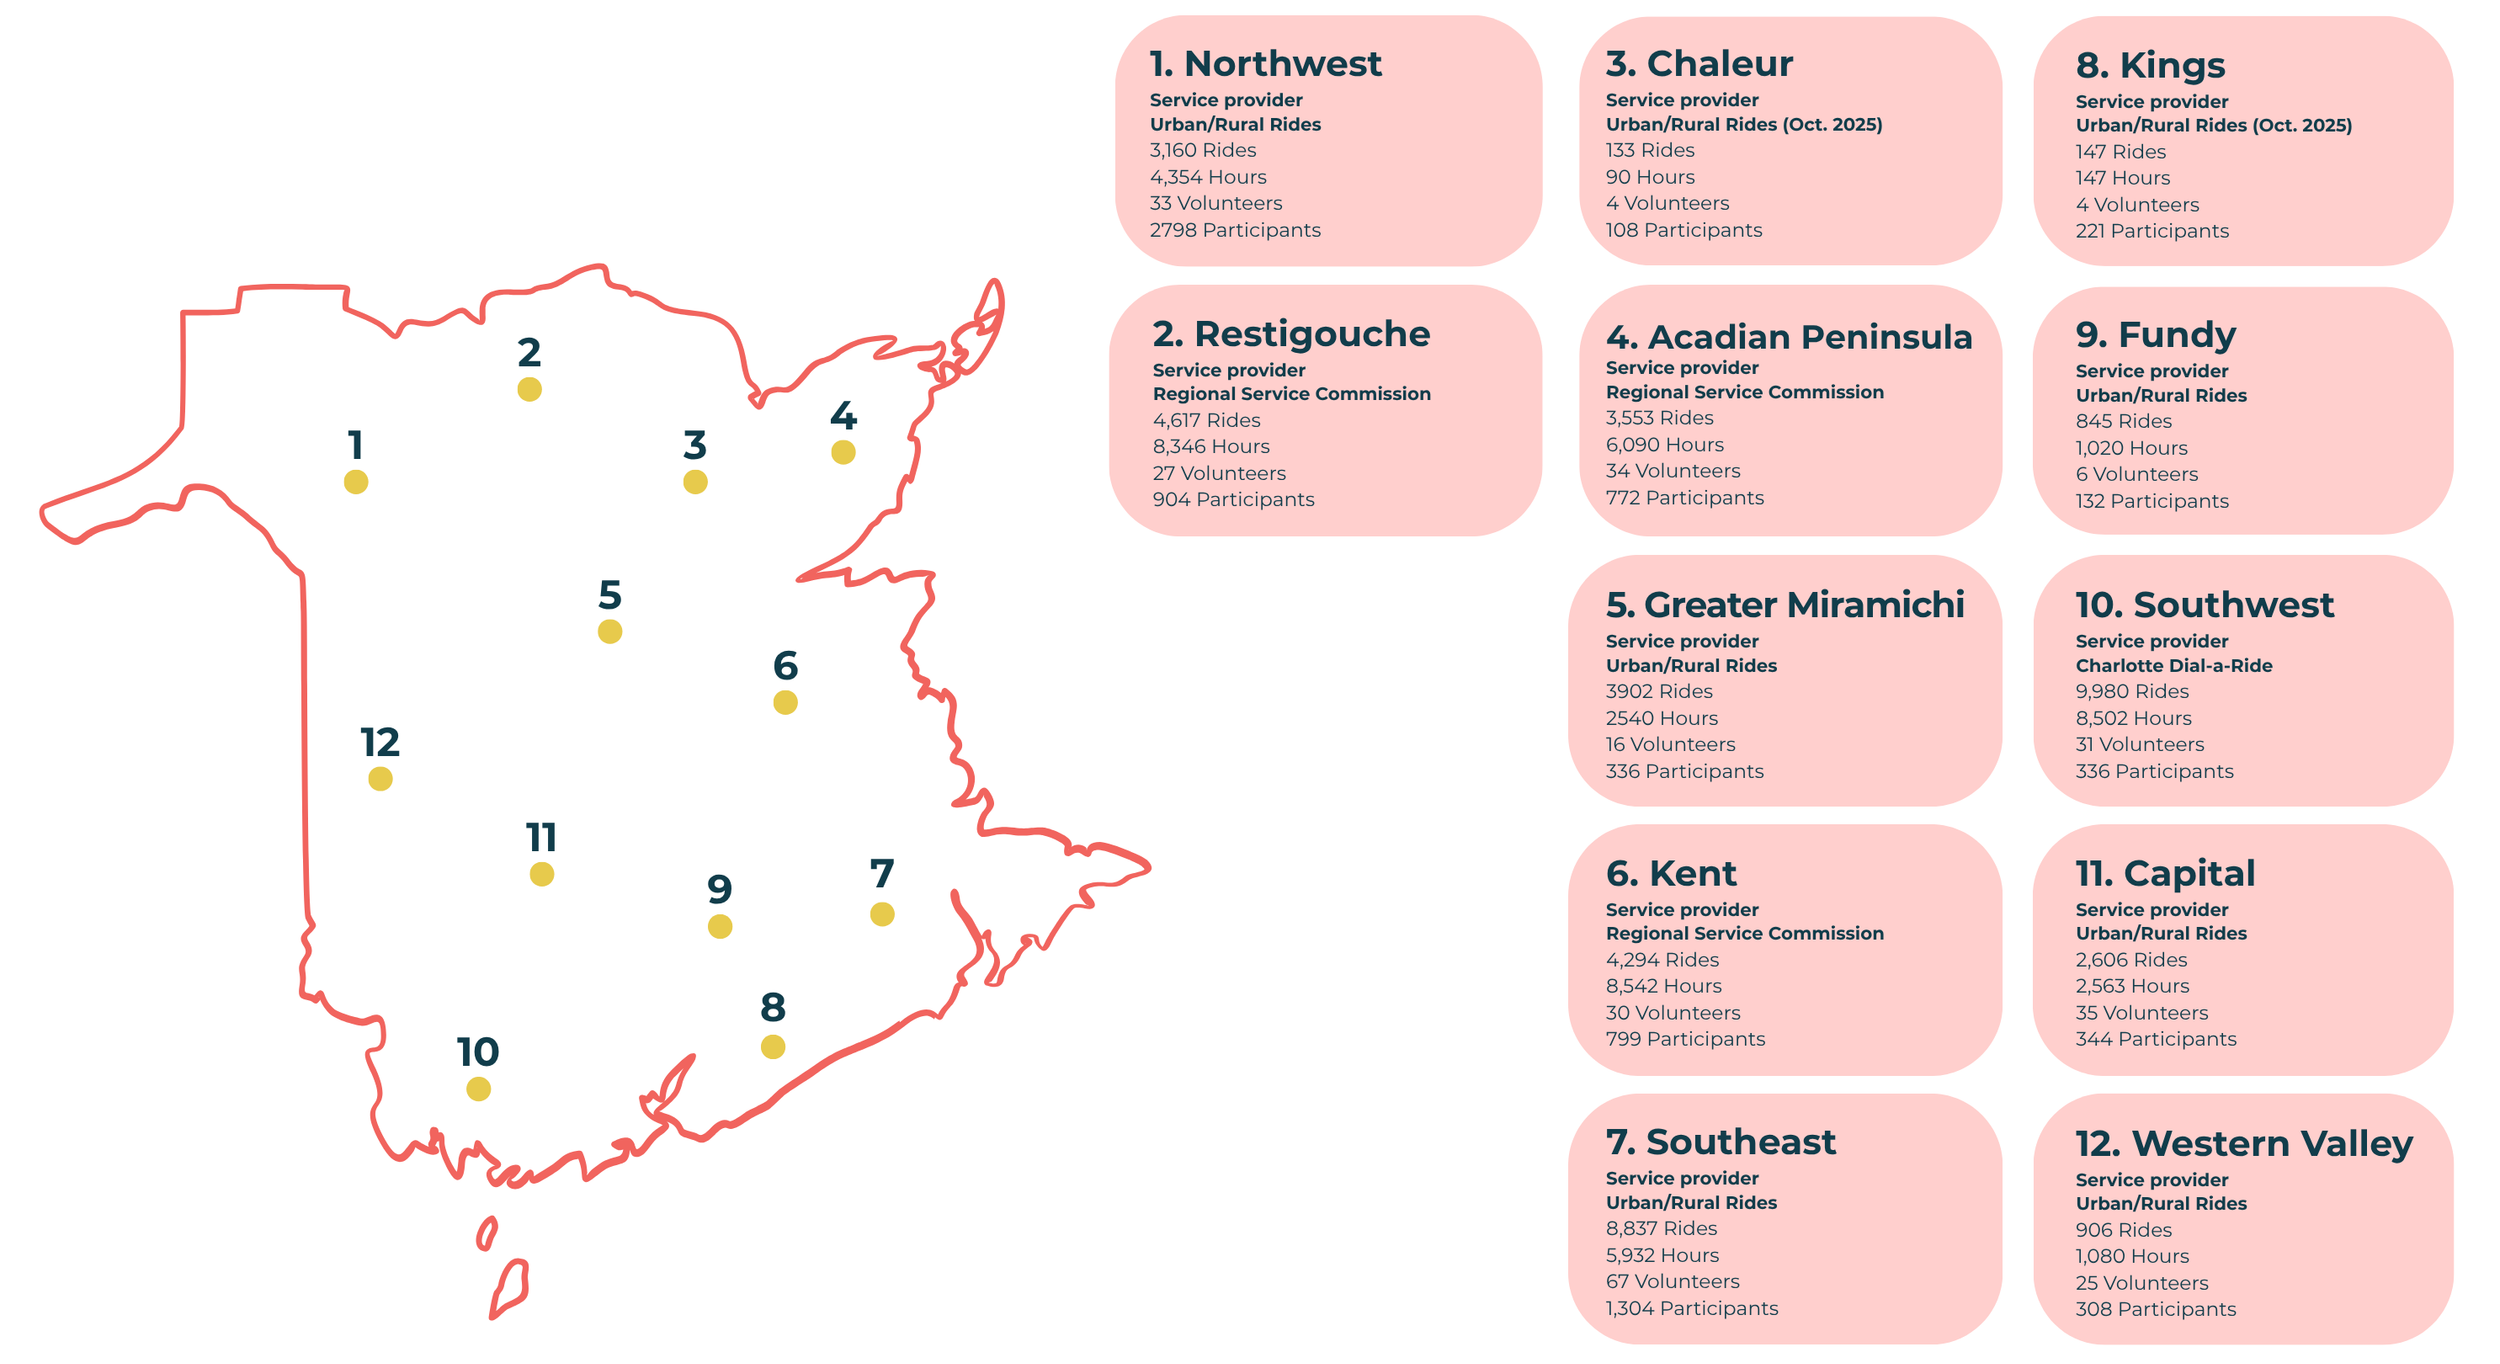
Community Transportation by Region Fiscal 2025-2026
For Chaleur and Kings regions, the data is representative of the period from October to March 31. Urban/Rural Rides took over the service delivery in Fall 2025.
Trends in Community Transportation From Fiscal 2023–2024 to 2024–2025
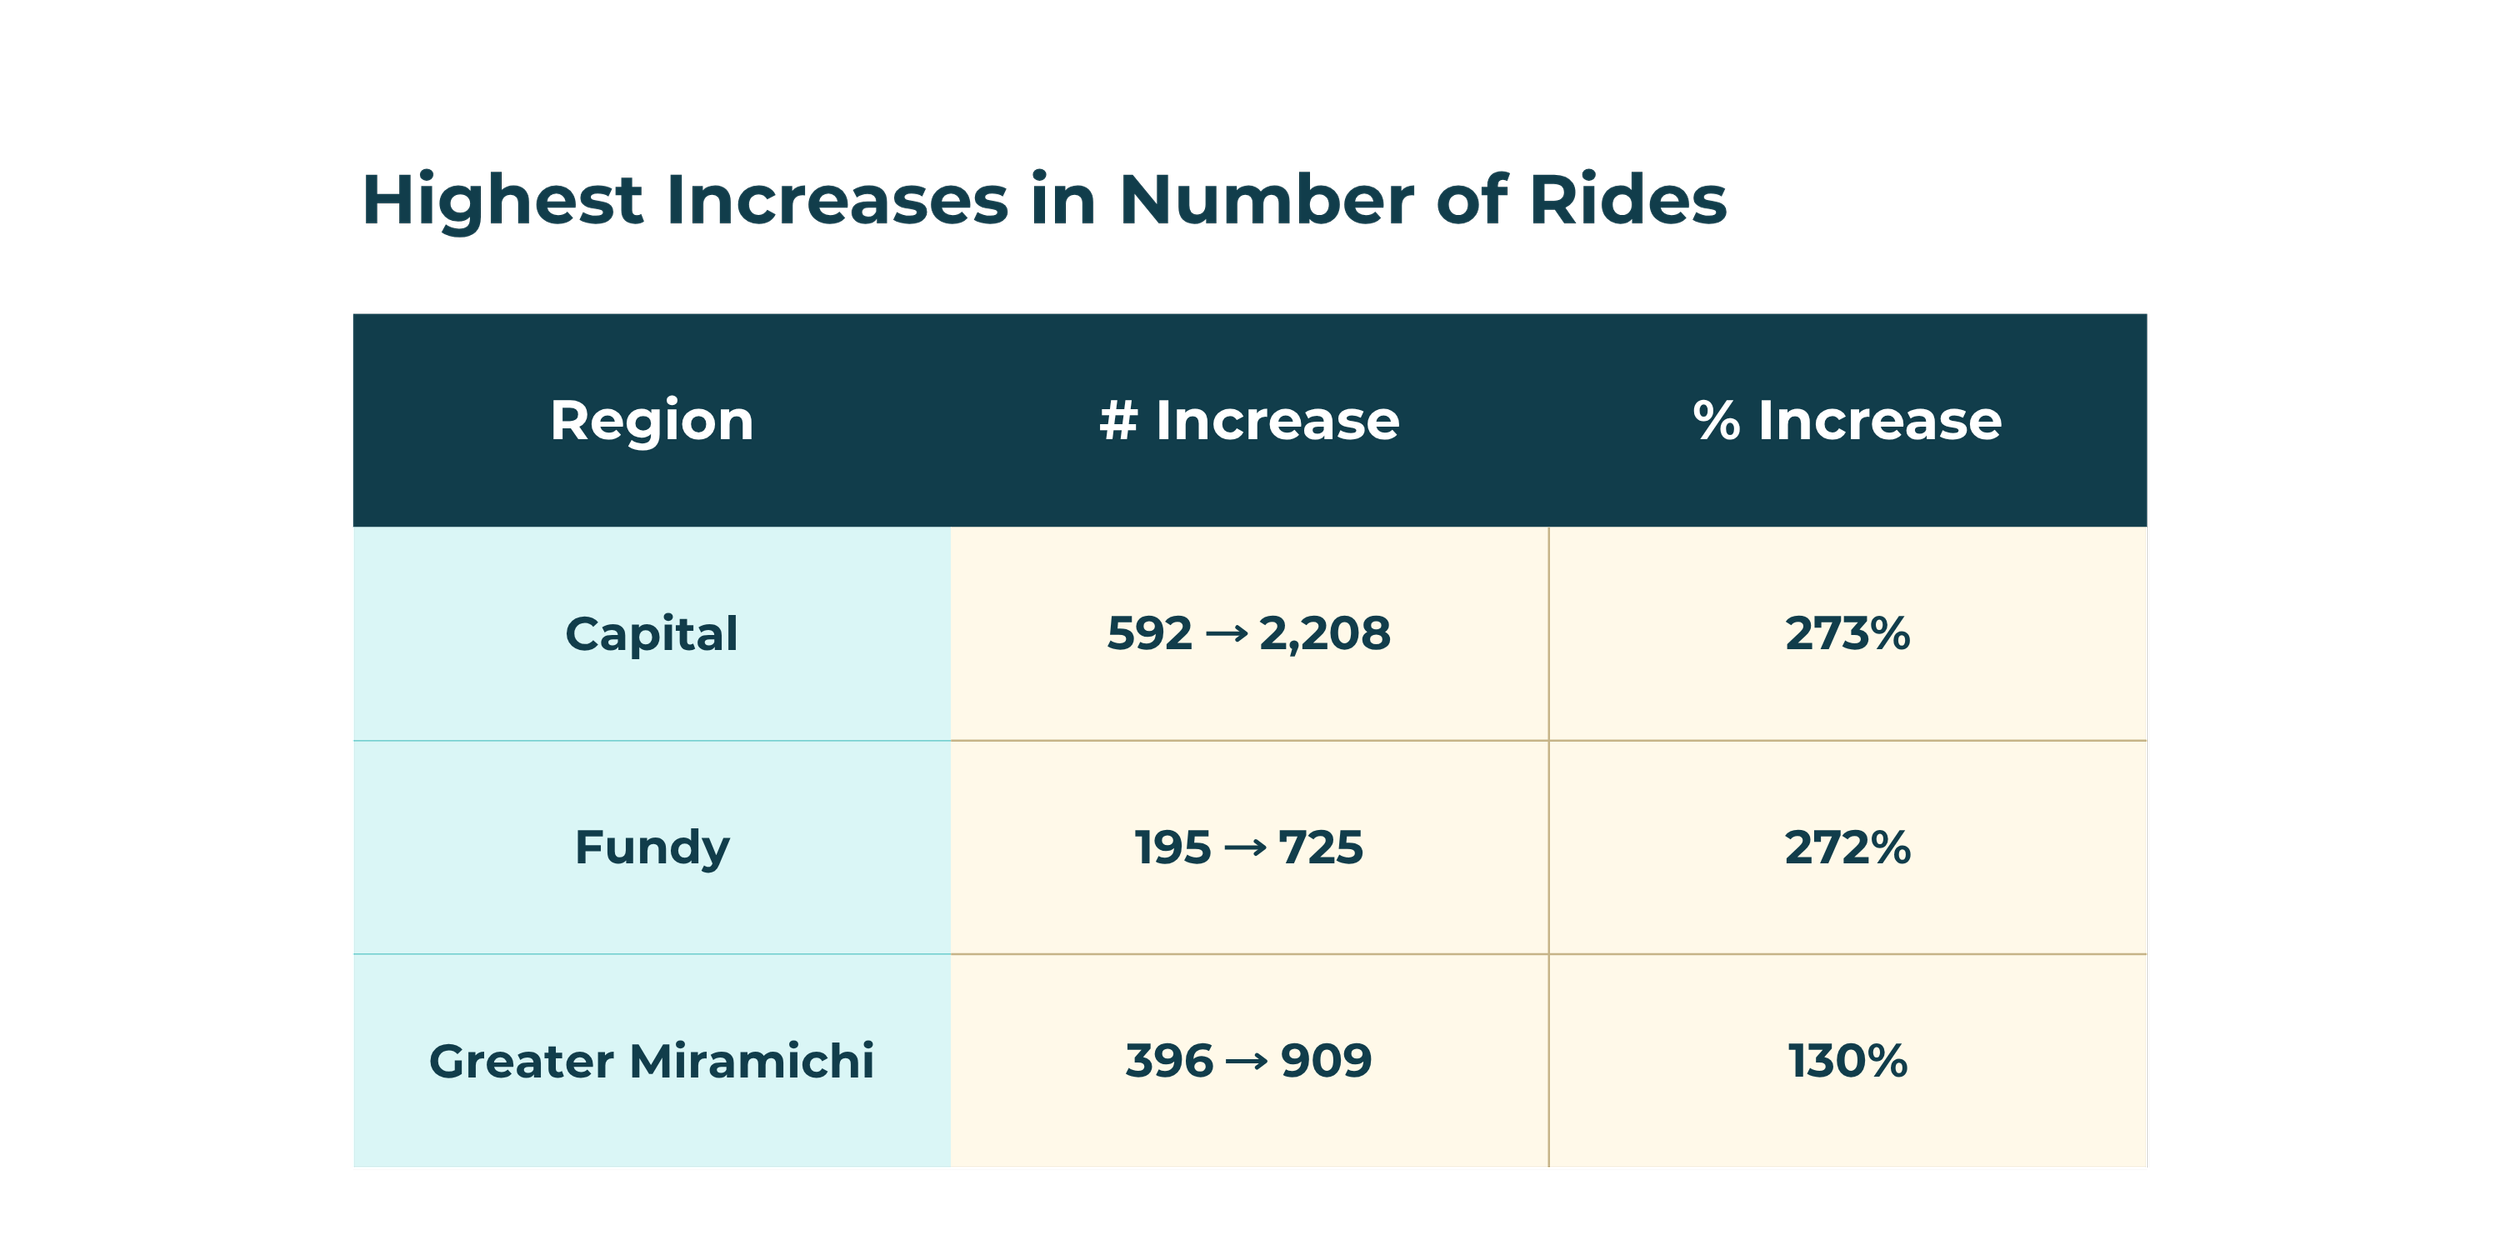
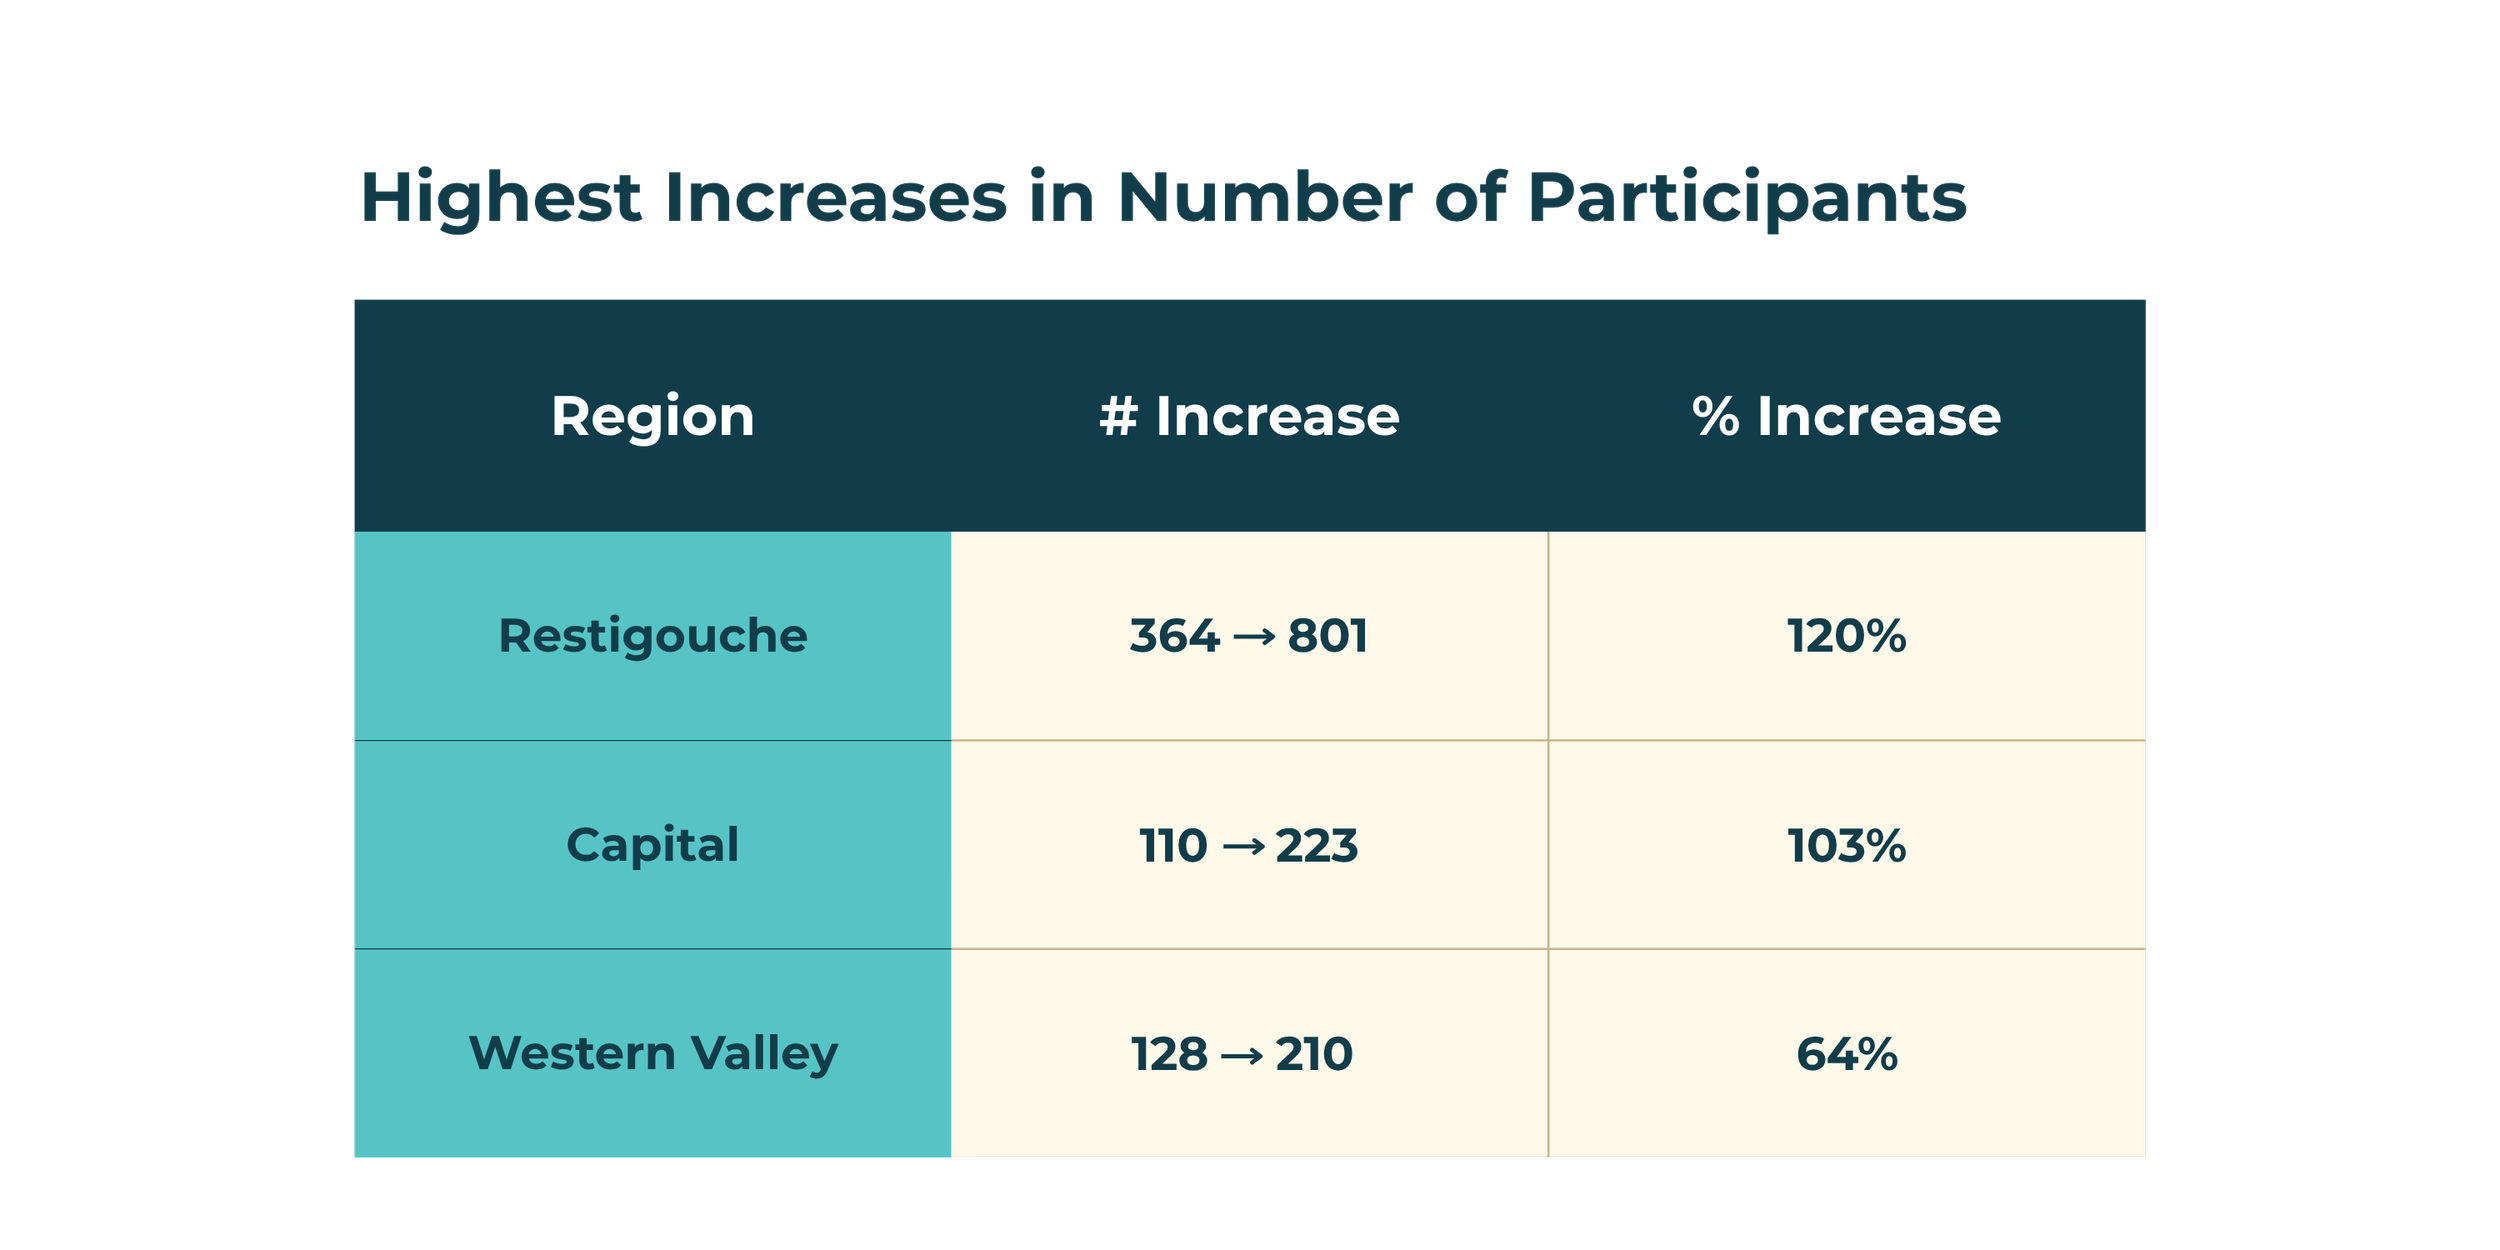
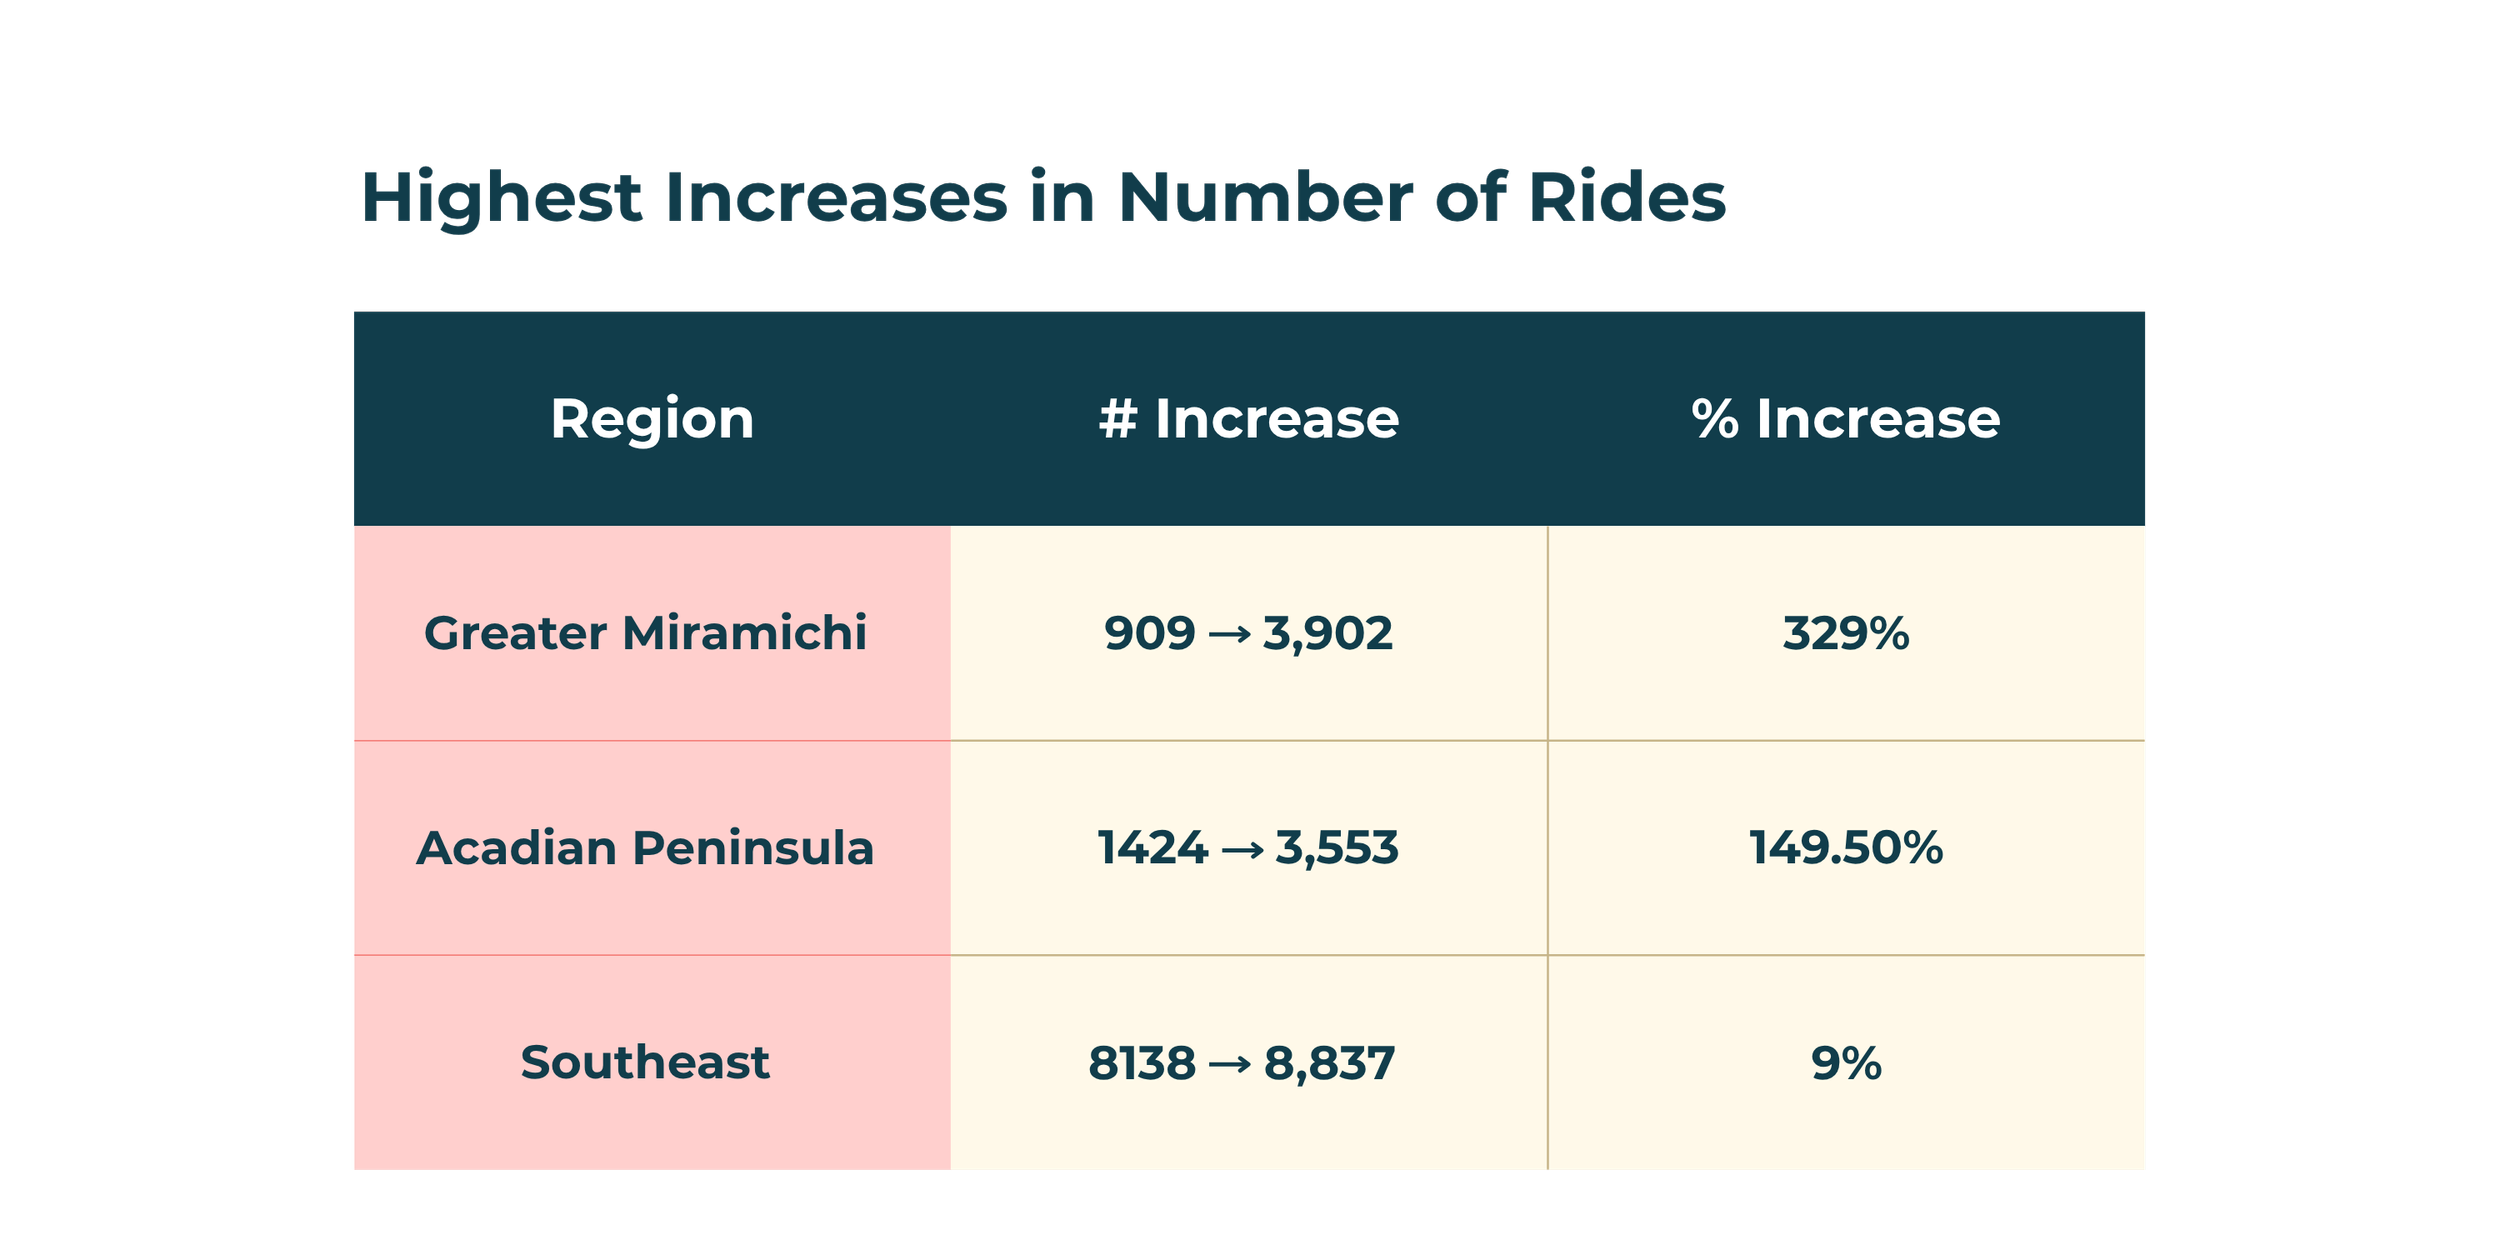
Trends in Community Transportation From Fiscal 2024–2025 to 2025–2026
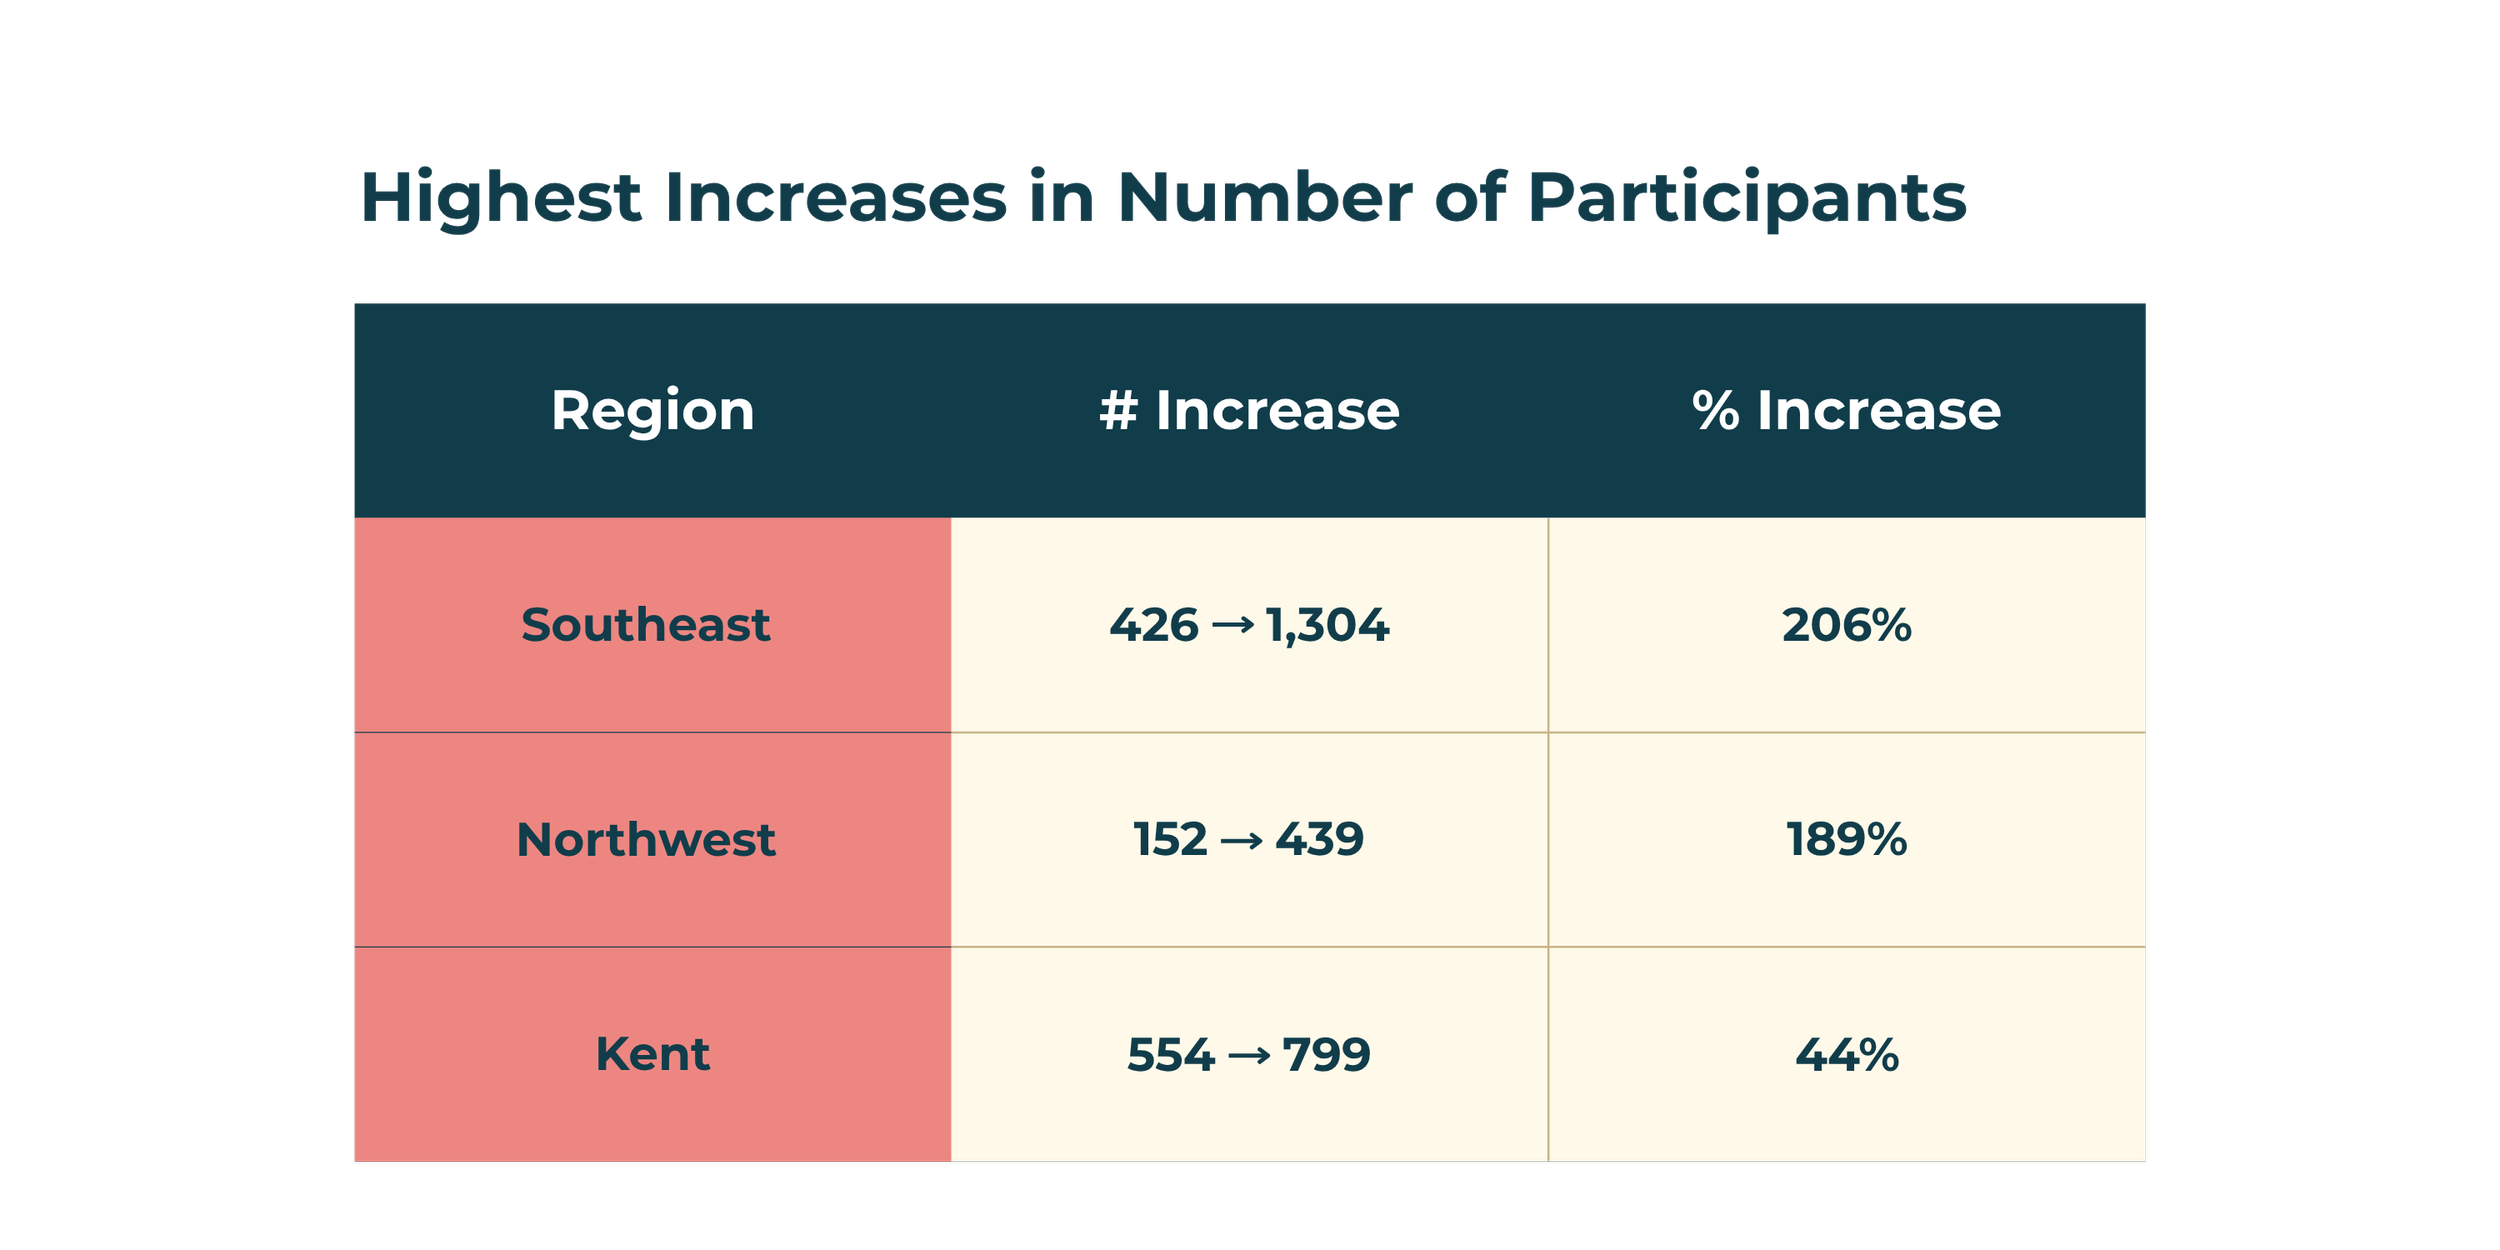
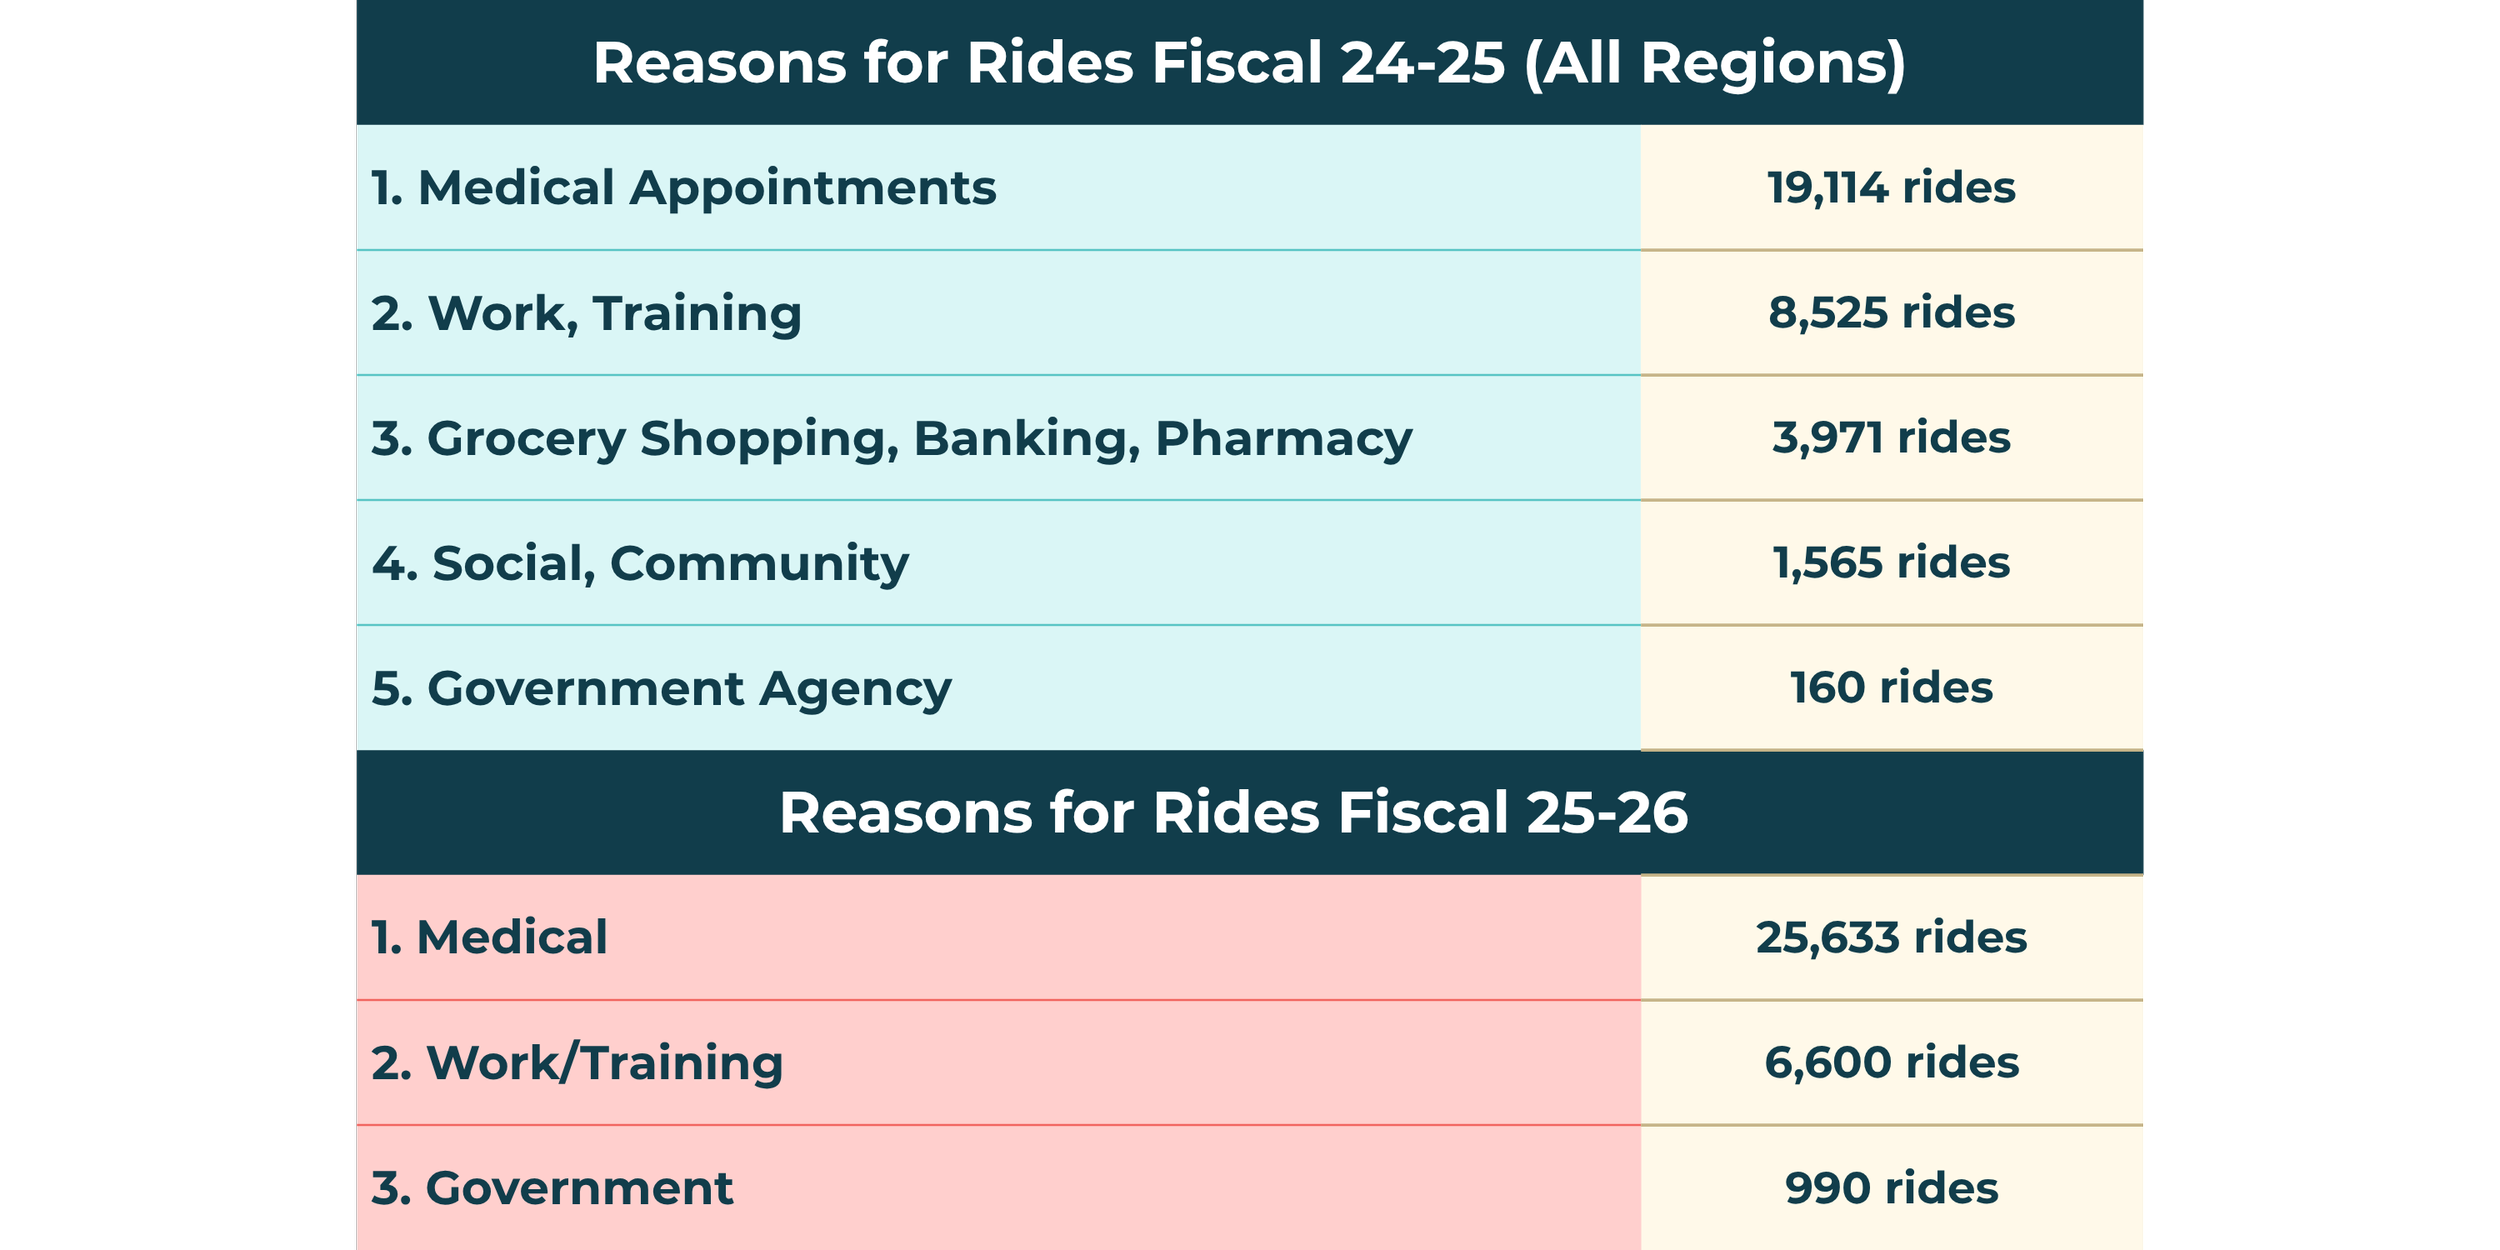
Medical Appointments
These remain as the most common reason people use community transportation services.
Demand for medical transportation increased by 6,519 rides (34%).
Public Transportation
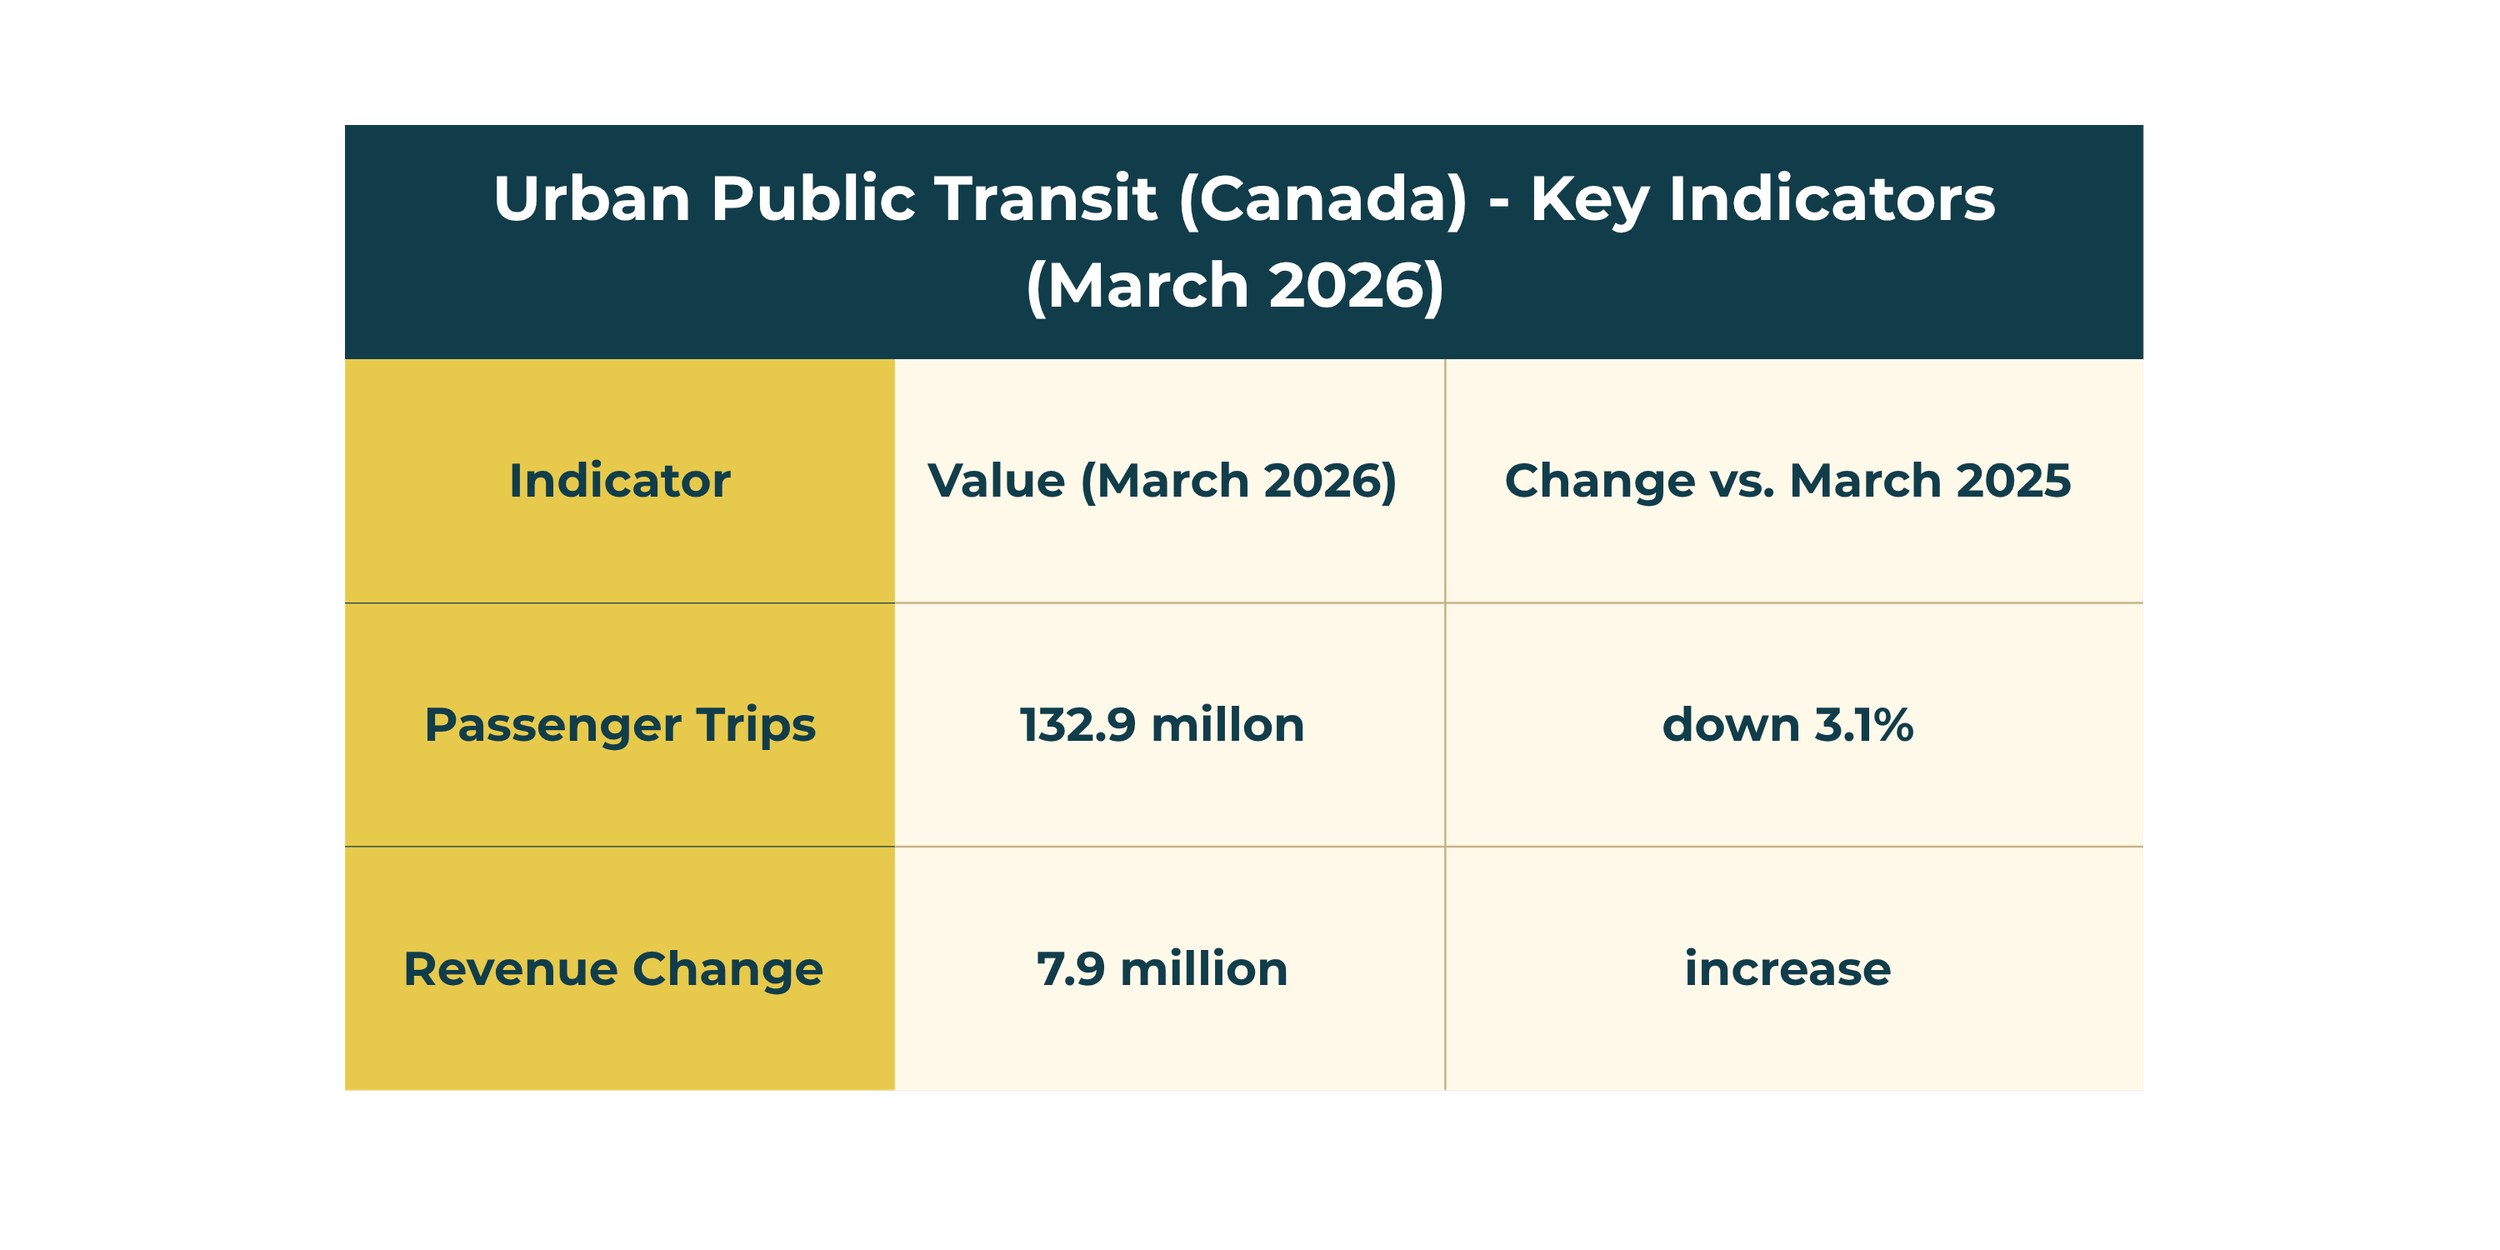
In March 2026, fewer people used public transit across Canada compared to the previous year. Though, total revenue still increased, suggesting that higher fares, fare adjustments, or changes in trip patterns may have offset a decline in ridership.

Child Care Connect NB
29% of children in New Brunswick live in childcare deserts, meaning that there are more than three children (who are not yet in kindergarten) for every licensed full-time space.
Child Care Connect NB is a provincial matching service that helps connect families with licensed childcare providers that have available spaces meeting their needs while also helping the government identify where additional childcare spaces are needed.
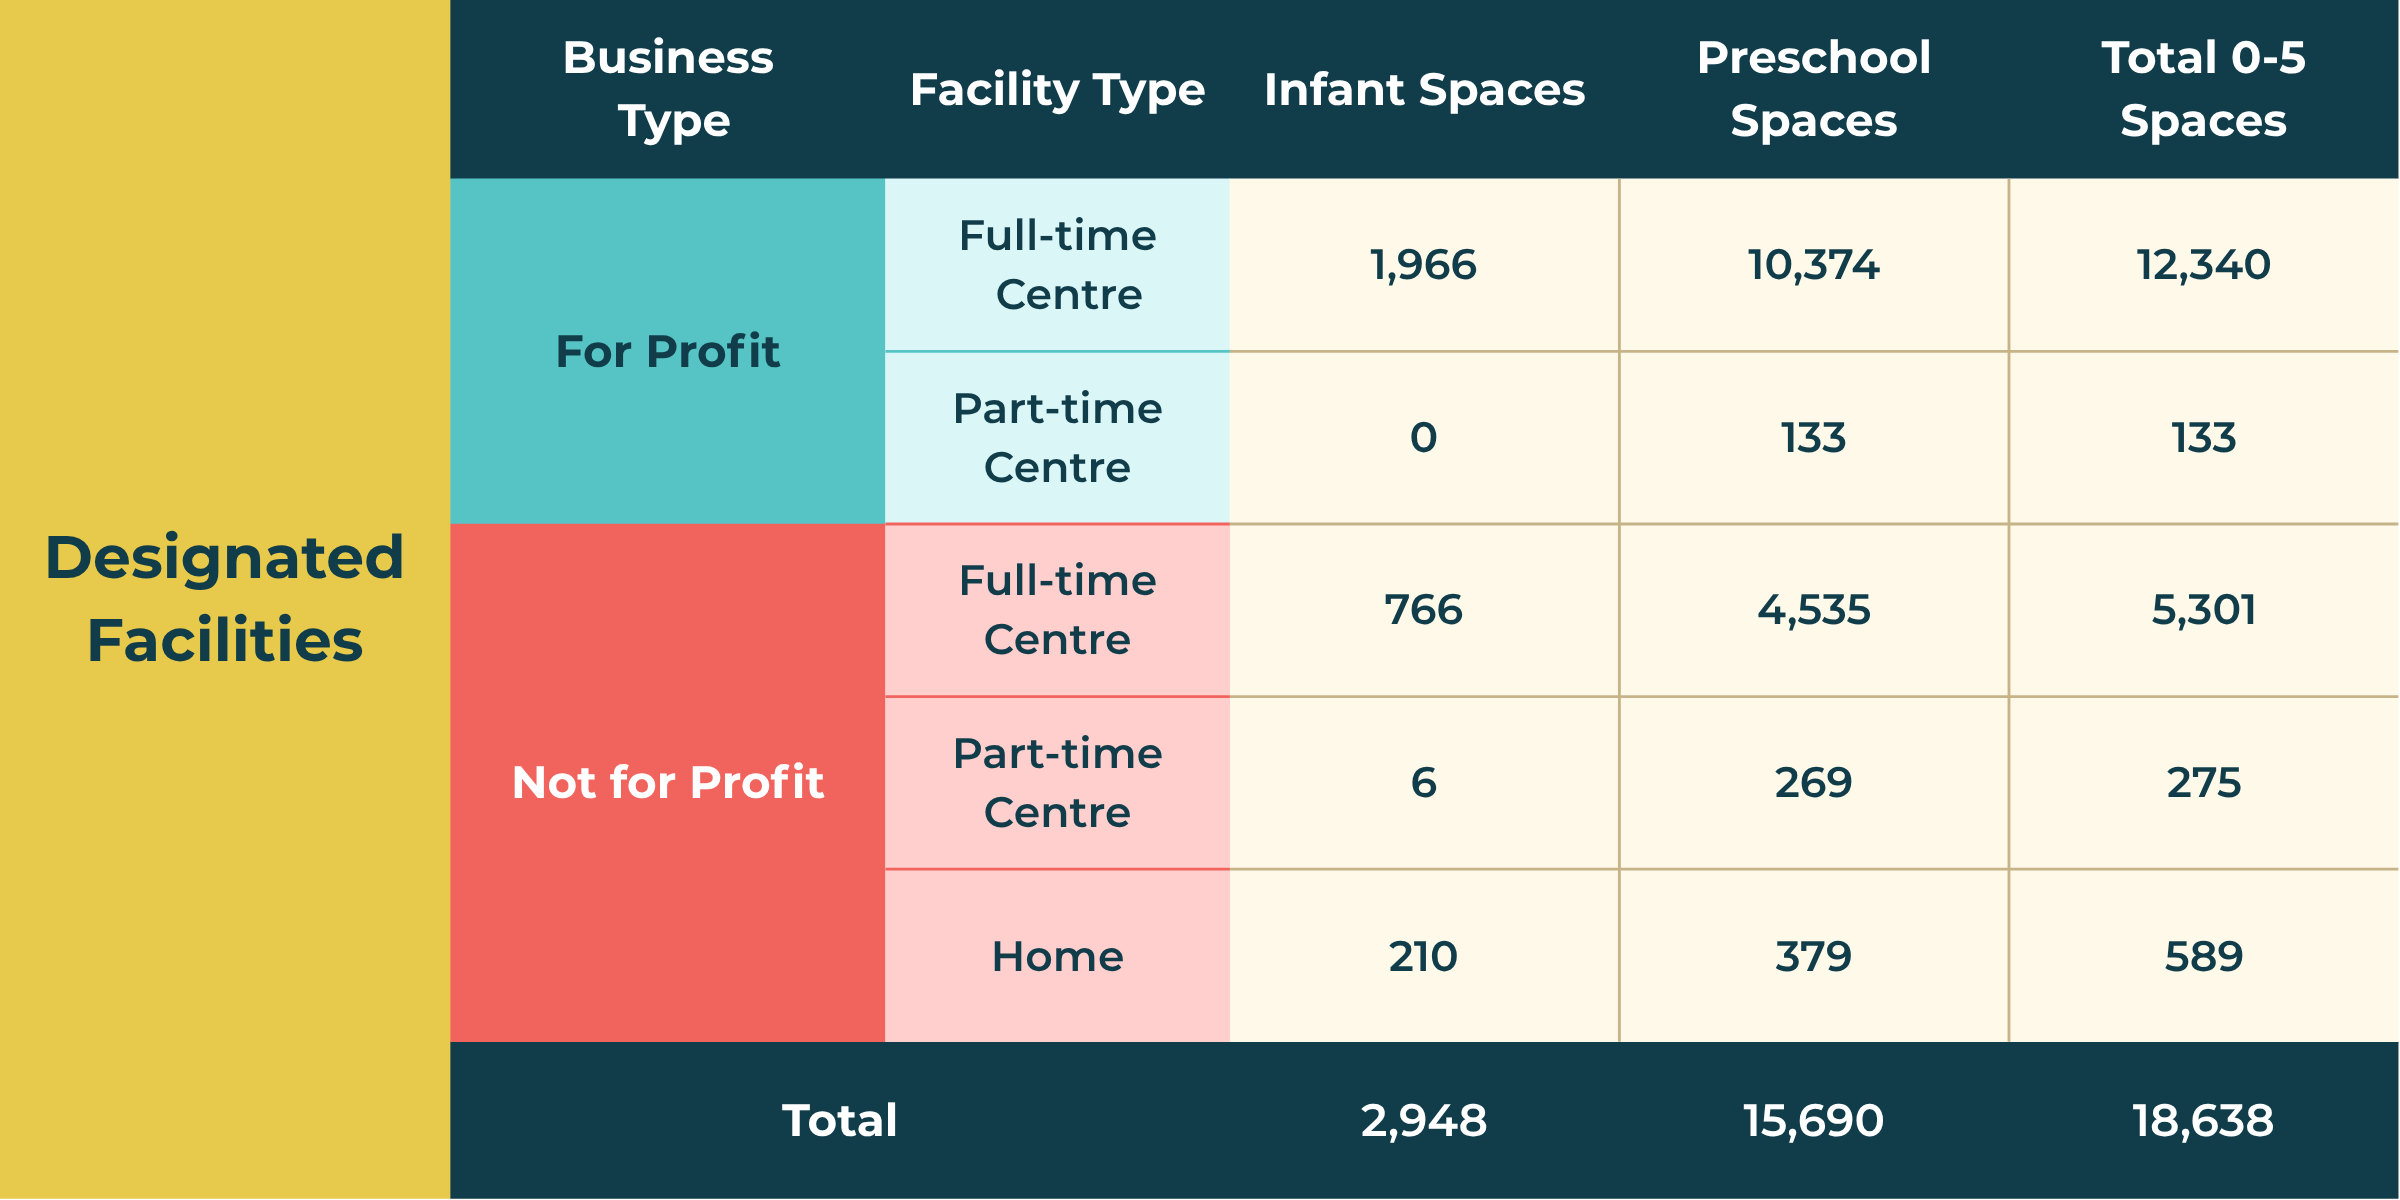
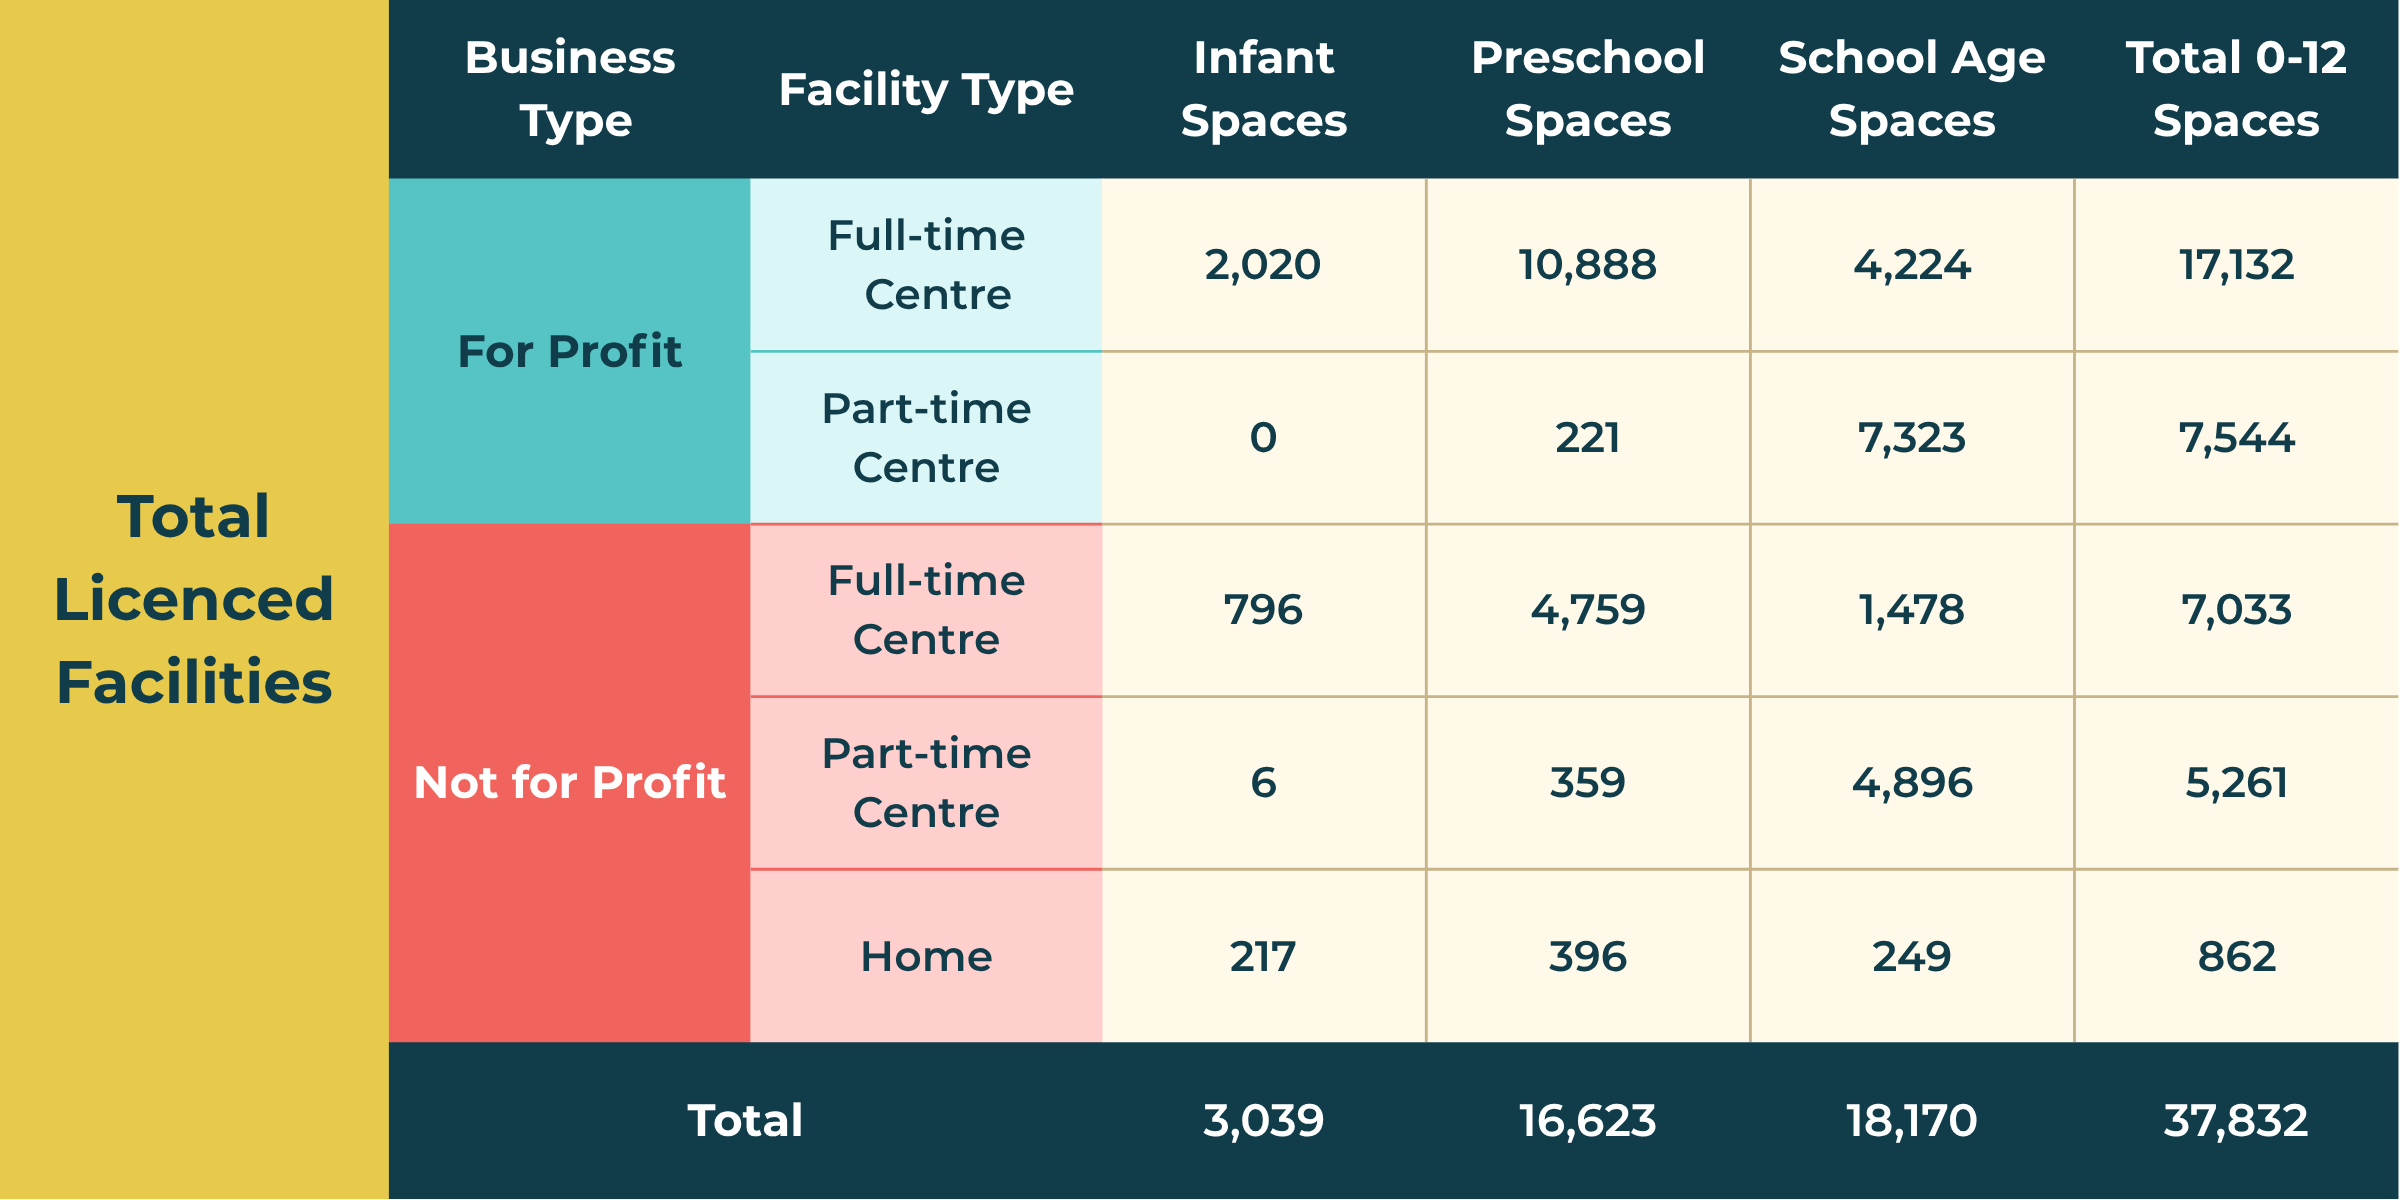
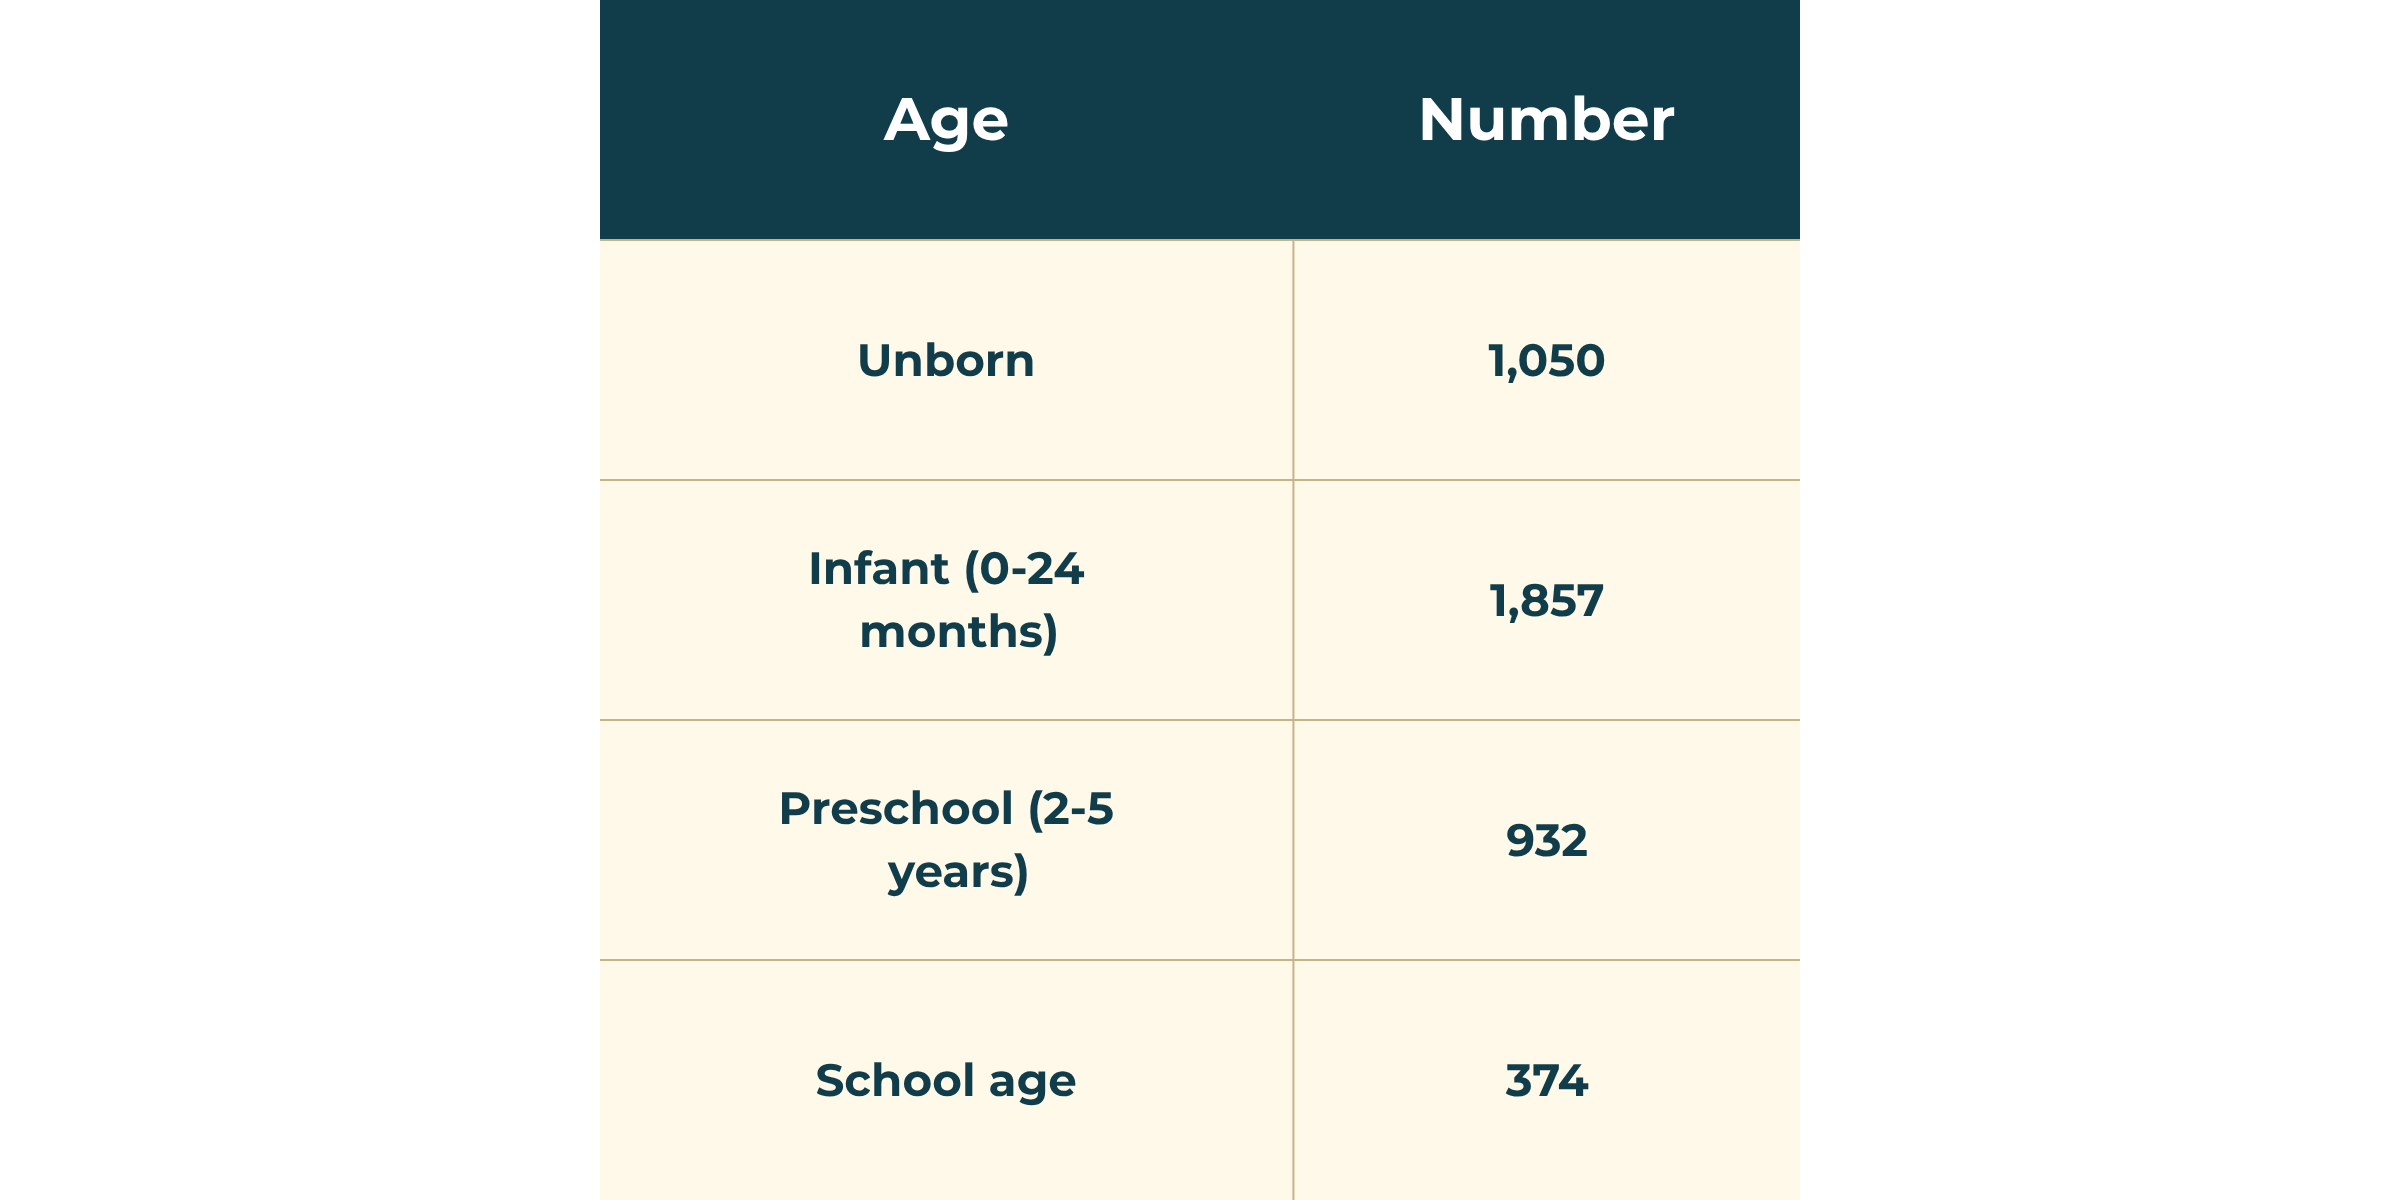
Above are the number of children registered on Child Care Connect NB as of February 1, 2026
Designation of an early learning and child care facility is granted to licensed early learning and child care centres and homes that voluntarily apply and provide care to preschool children (ages 0-5, prior to school entry).
The operator commits to providing equitable and affordable access to higher quality, inclusive early learning and child care services by removing barriers linked to family income, children’s ability and needs, language, and minority settings.
Parents with preschool-aged children, enrolled in a designated facility, will pay a standard childcare fee. No applications, eligibility criteria, or income testing are required by parents.
Costs of Child Care
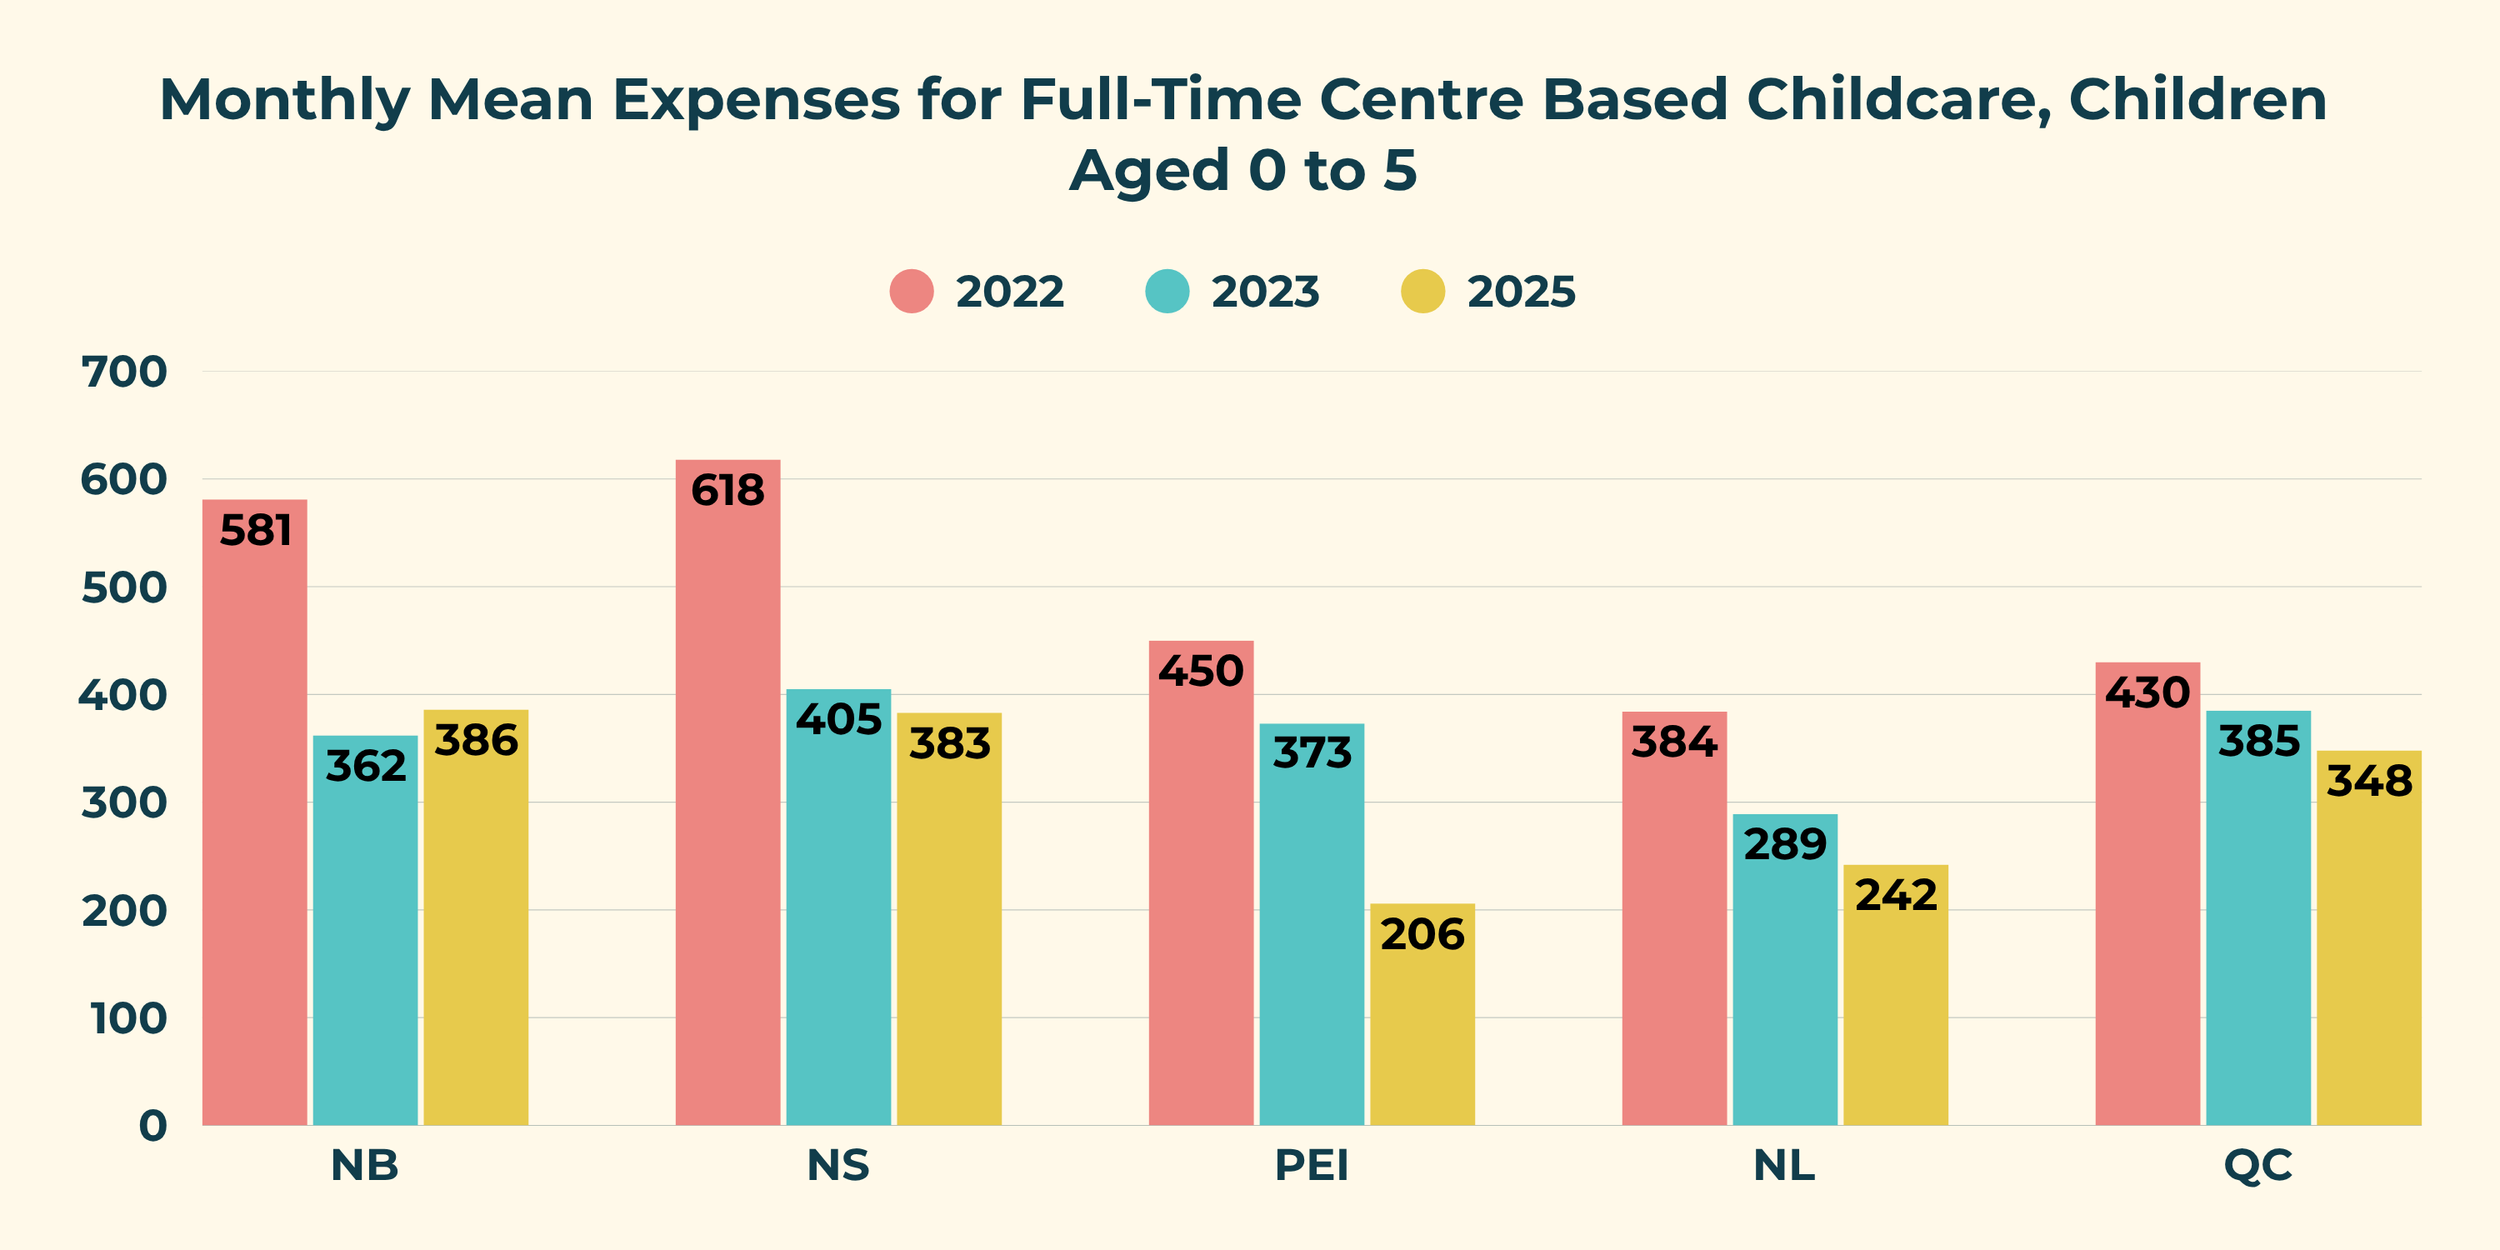
Monthly Mean Expenses for Full-Time Centre Based Childcare
In this graph we see the impact of the Canada-wide Early Learning and Child Care (CWELCC) agreements, commonly referred to as the "$10-a-day child care" initiative. We can see the mean cost in New Brunswick and surrounding provinces.
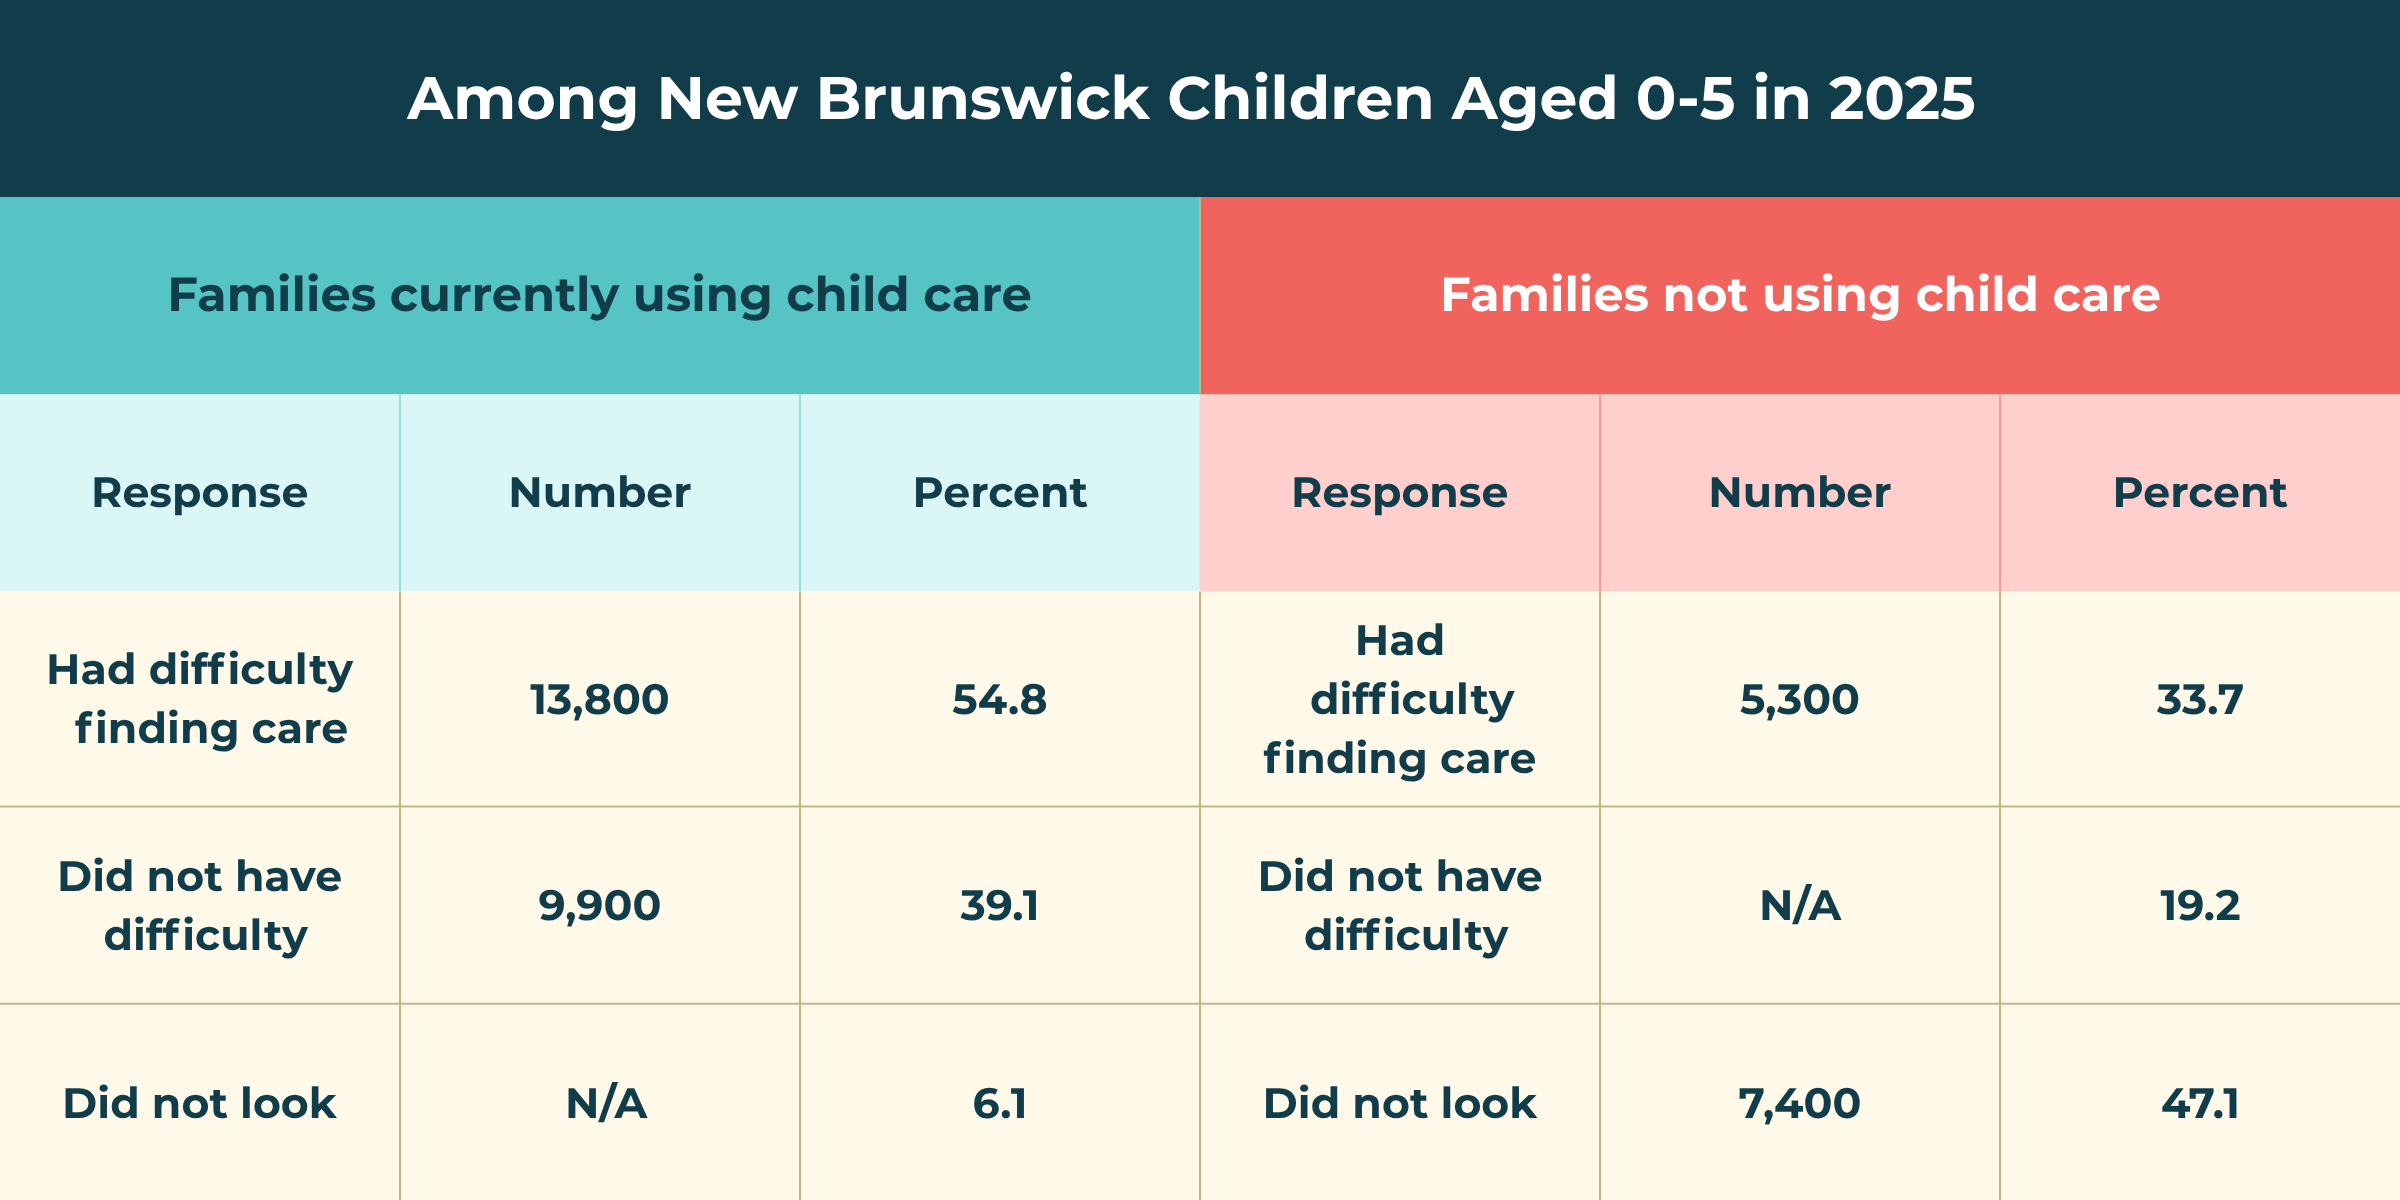
Child Care in New Brunswick
New Brunswick has made meaningful progress in reducing child-care costs for families, but access remains a significant challenge. On this Statistics Canada survey, more than half of child care users reported difficulty finding a space, suggesting that in addition to affordability, capacity is a barrier facing families.
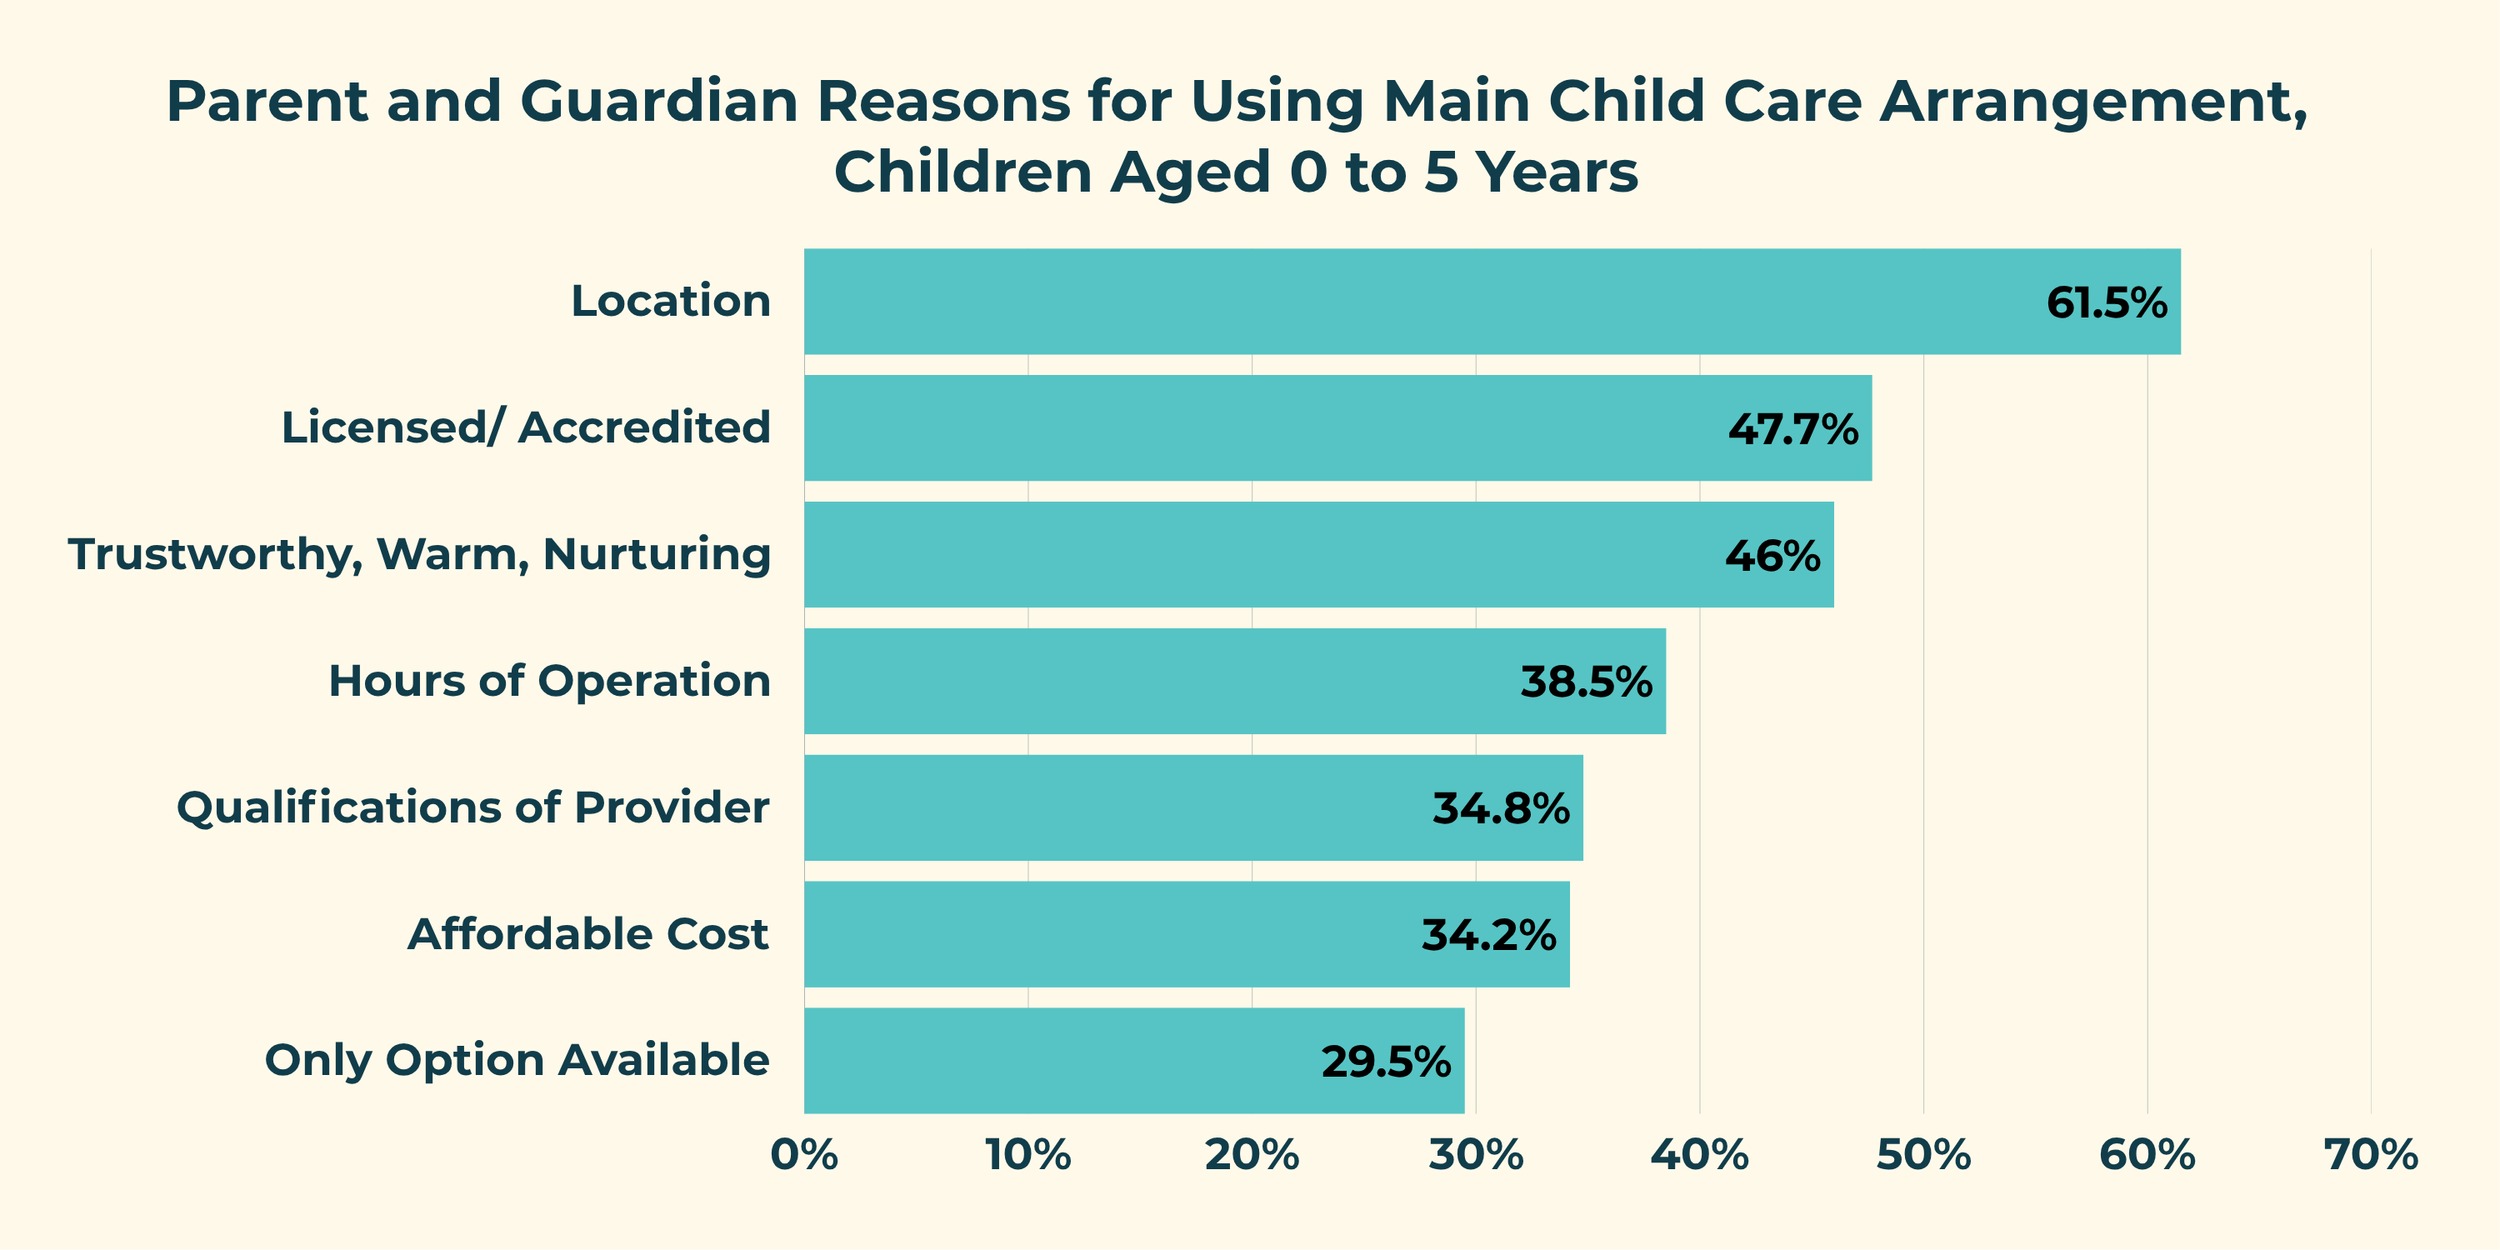
Reasons When Choosing a Child Care Arrangement
Parents choose child care for a variety of reasons. Statistics Canada data for New Brunswick shows that parents are choosing childcare primarily based on practical access and trust rather than price.
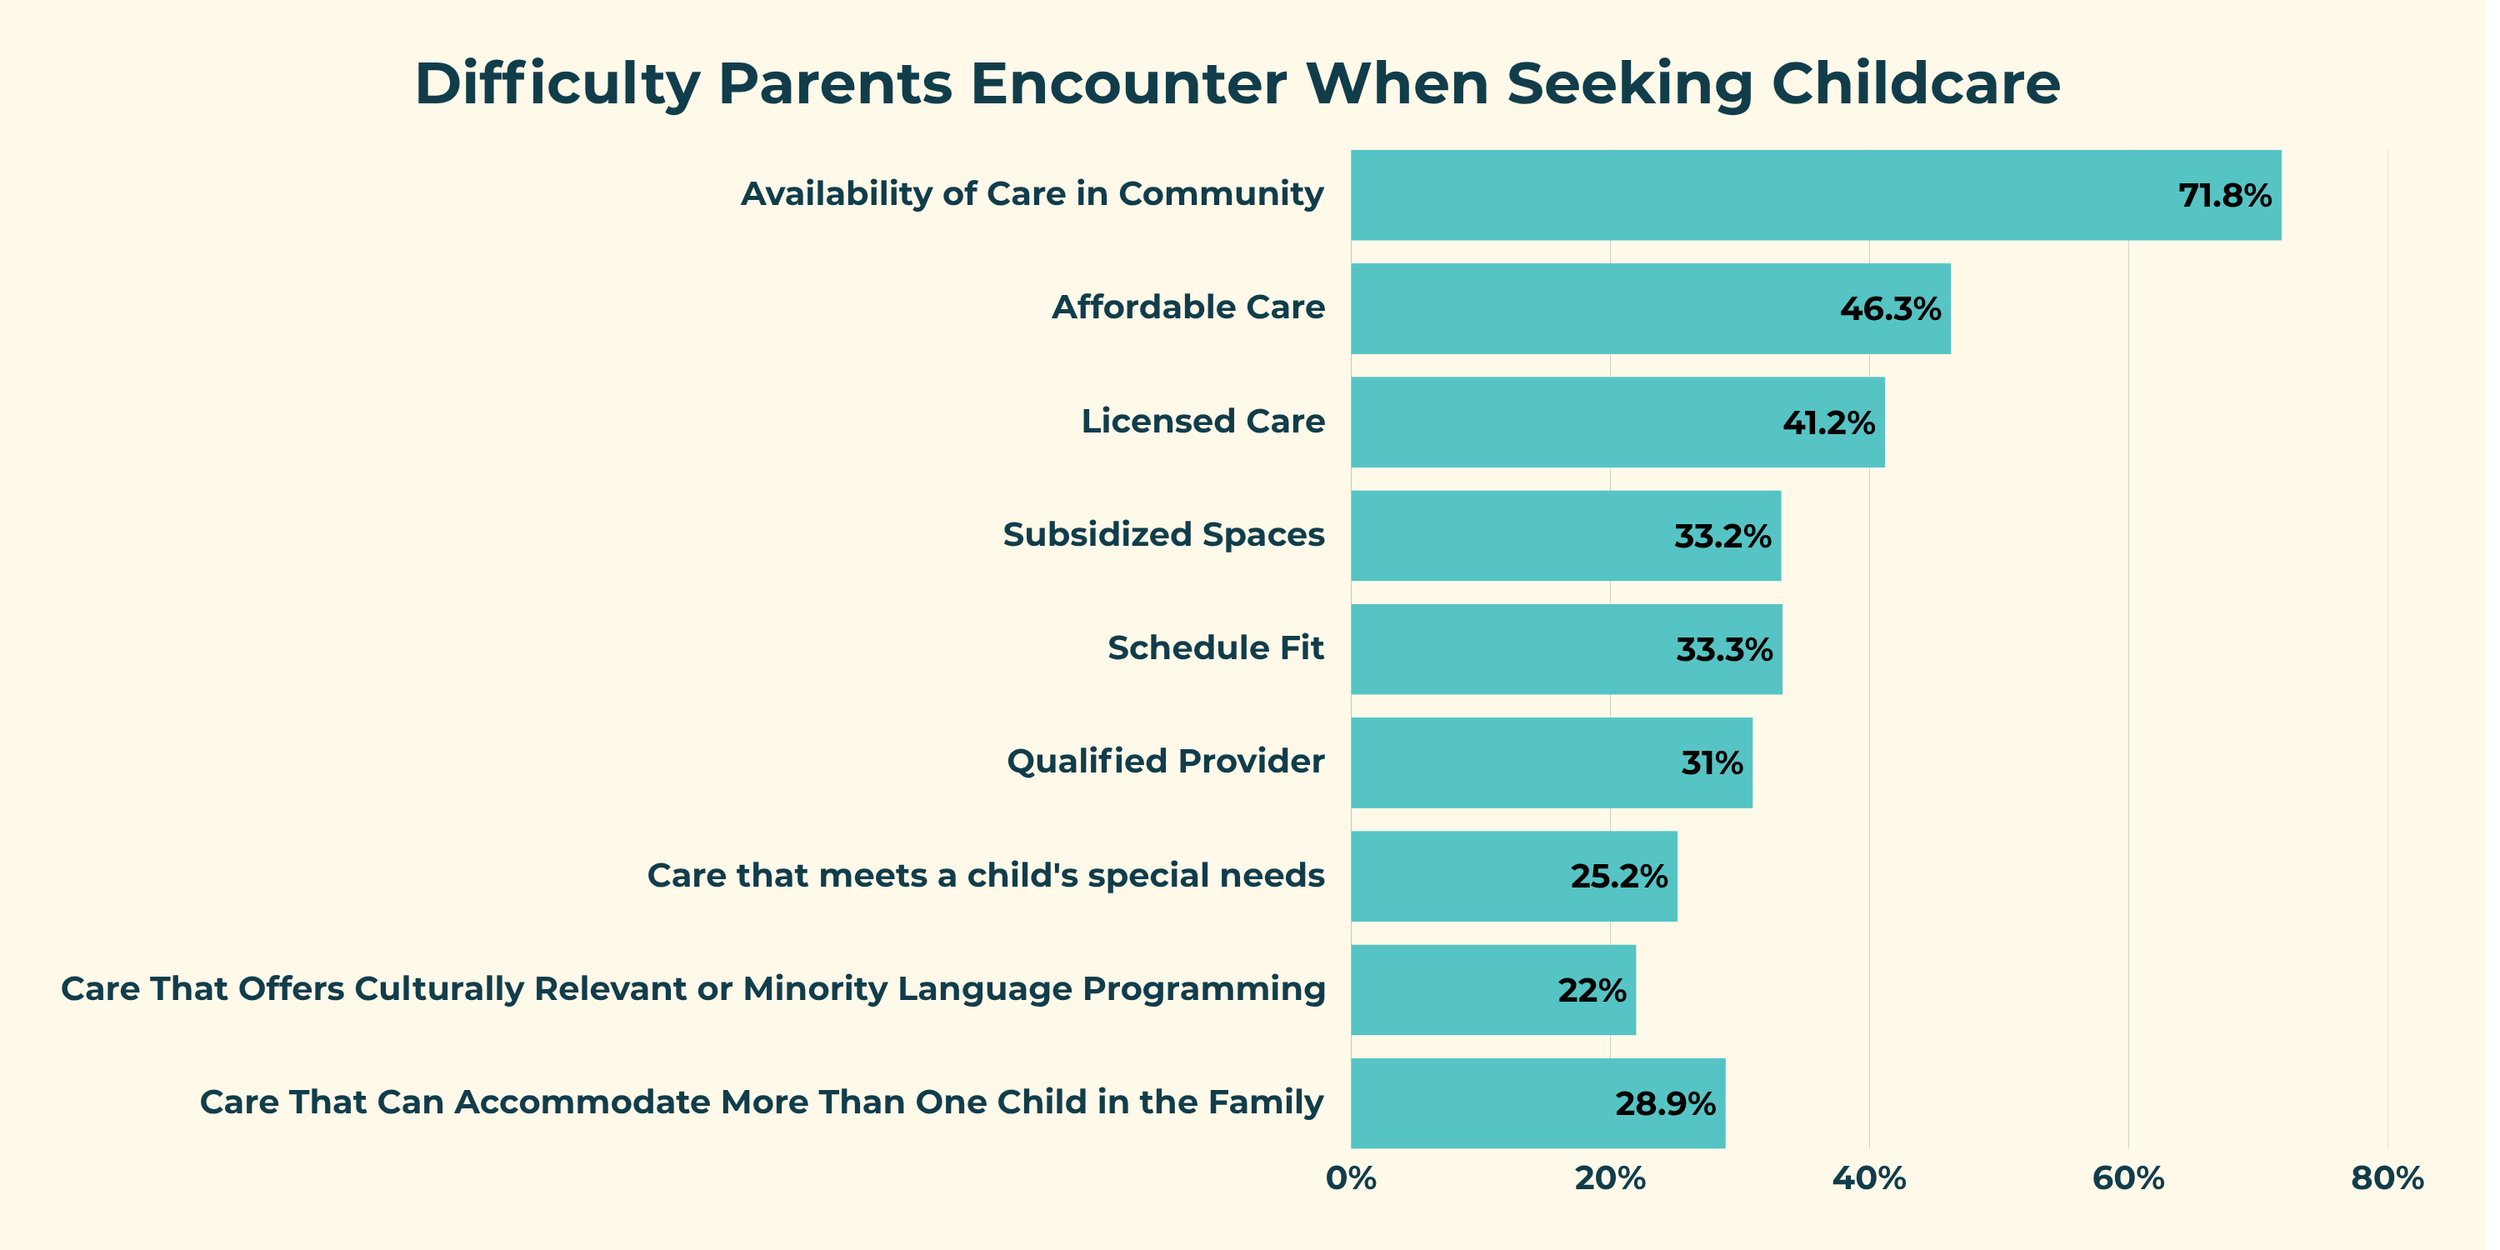
Difficulties When Seeking Child care
Statistics Canada survey data for New Brunswick suggests that the dominant child-care challenge in New Brunswick appears to be a shortage of available spaces in local communities.
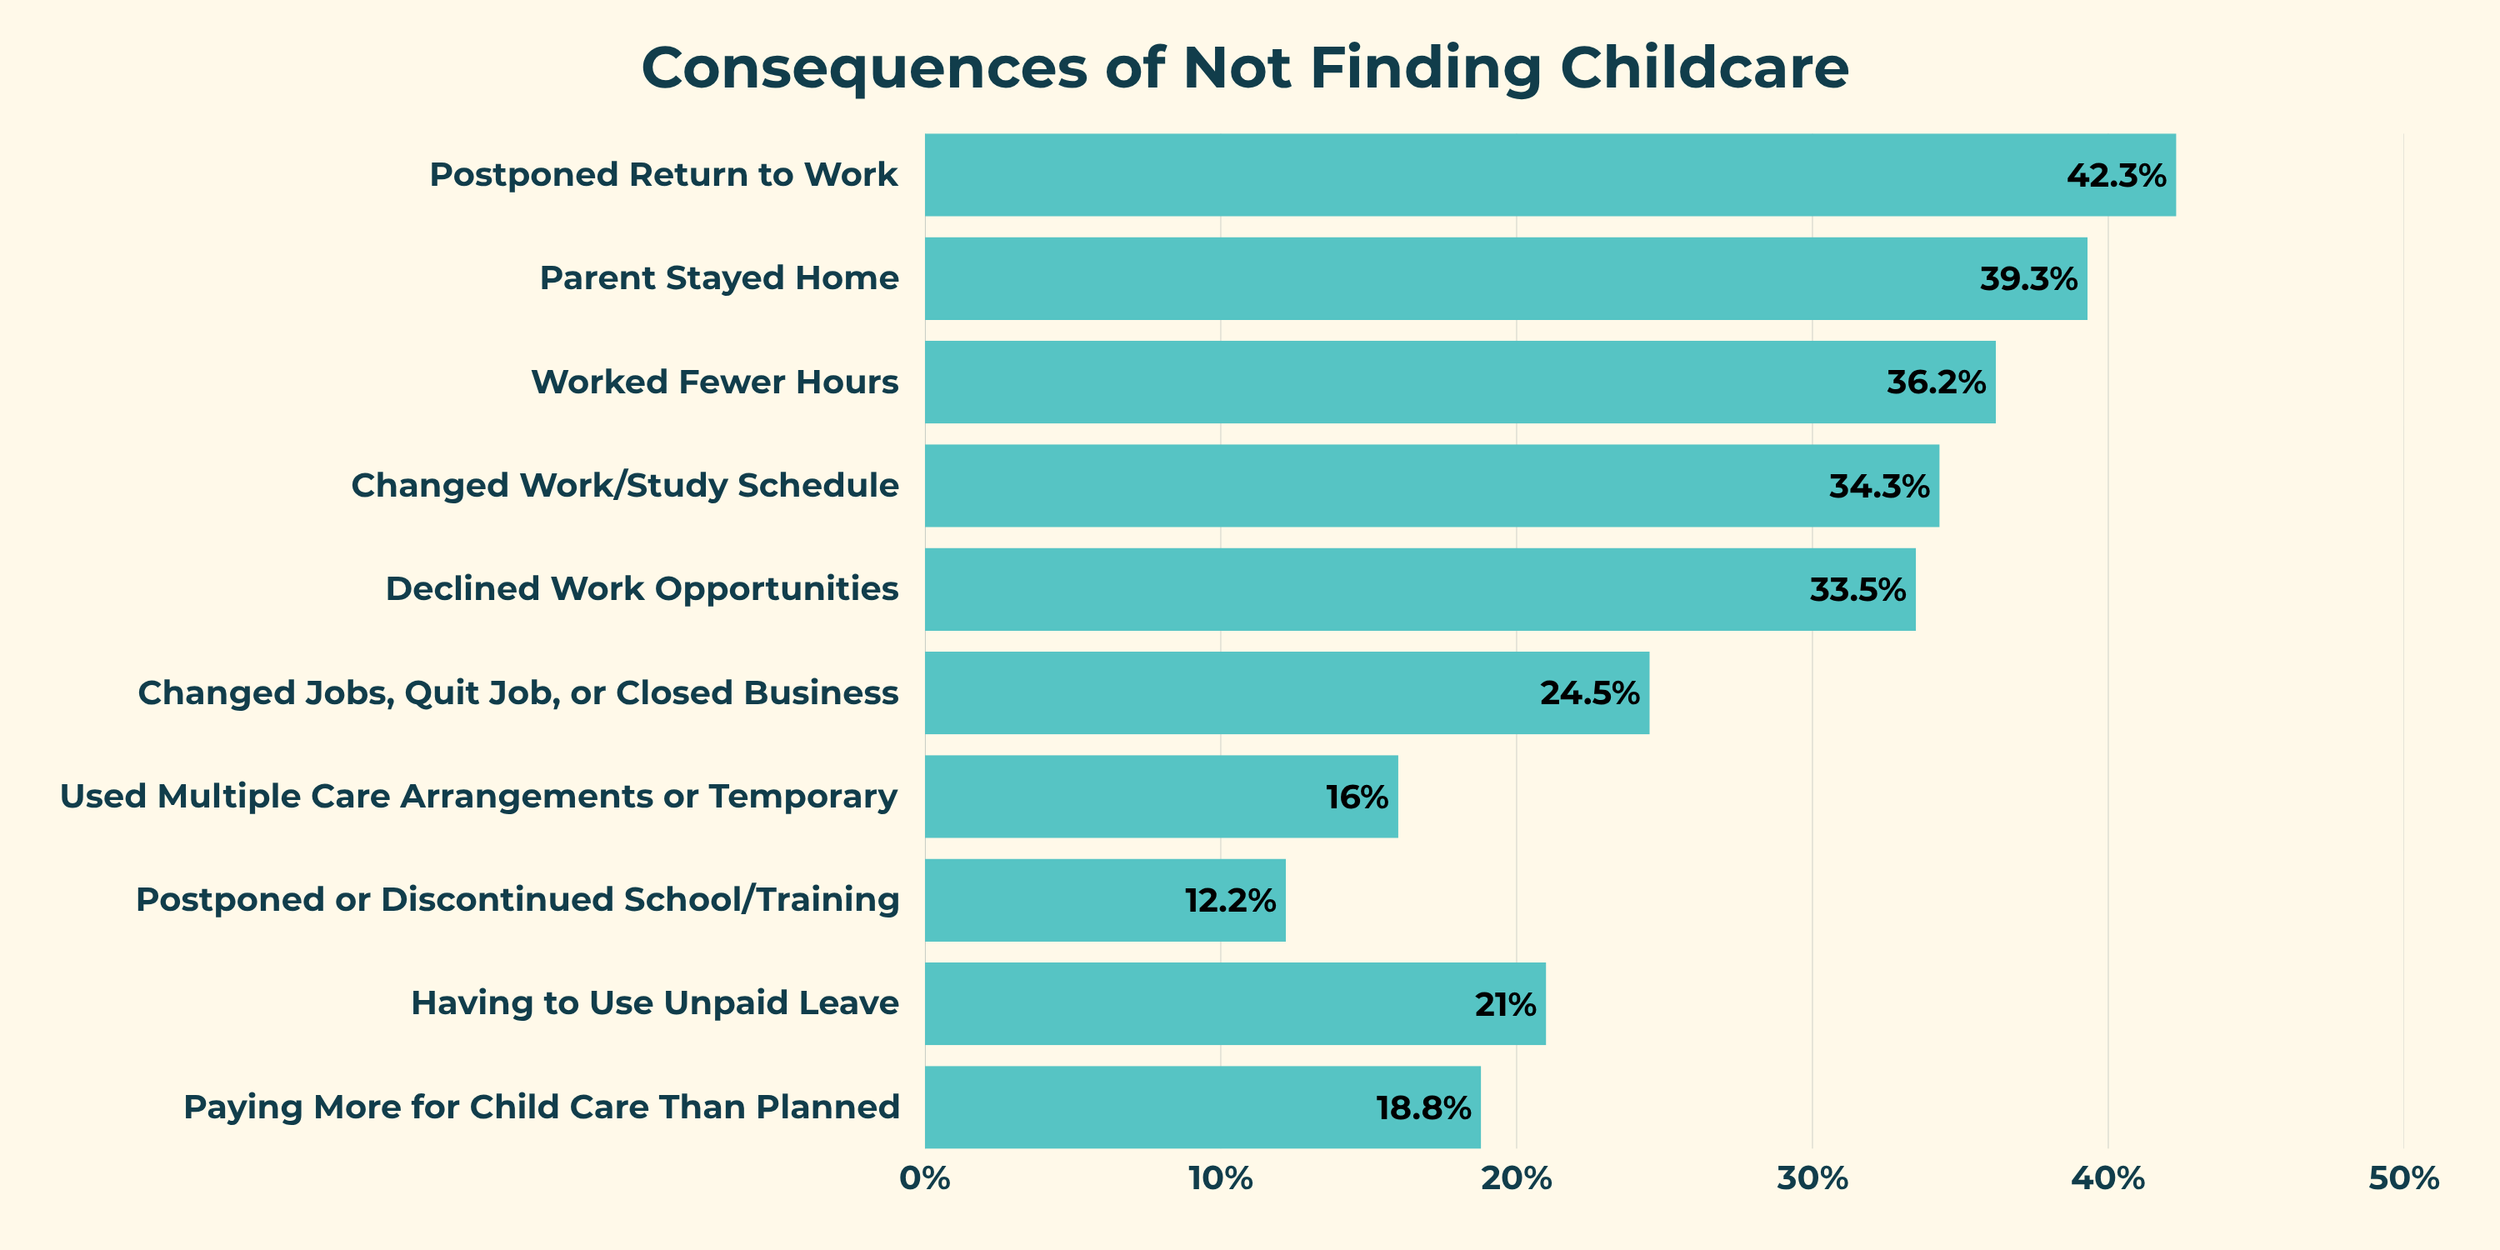
Consequences of Not Finding Child Care
Statistics Canada data shows that families who report difficulty finding child care face hard decisions. The recent survey data reveals that many experience significant employment related consequences when child care cannot be secured.
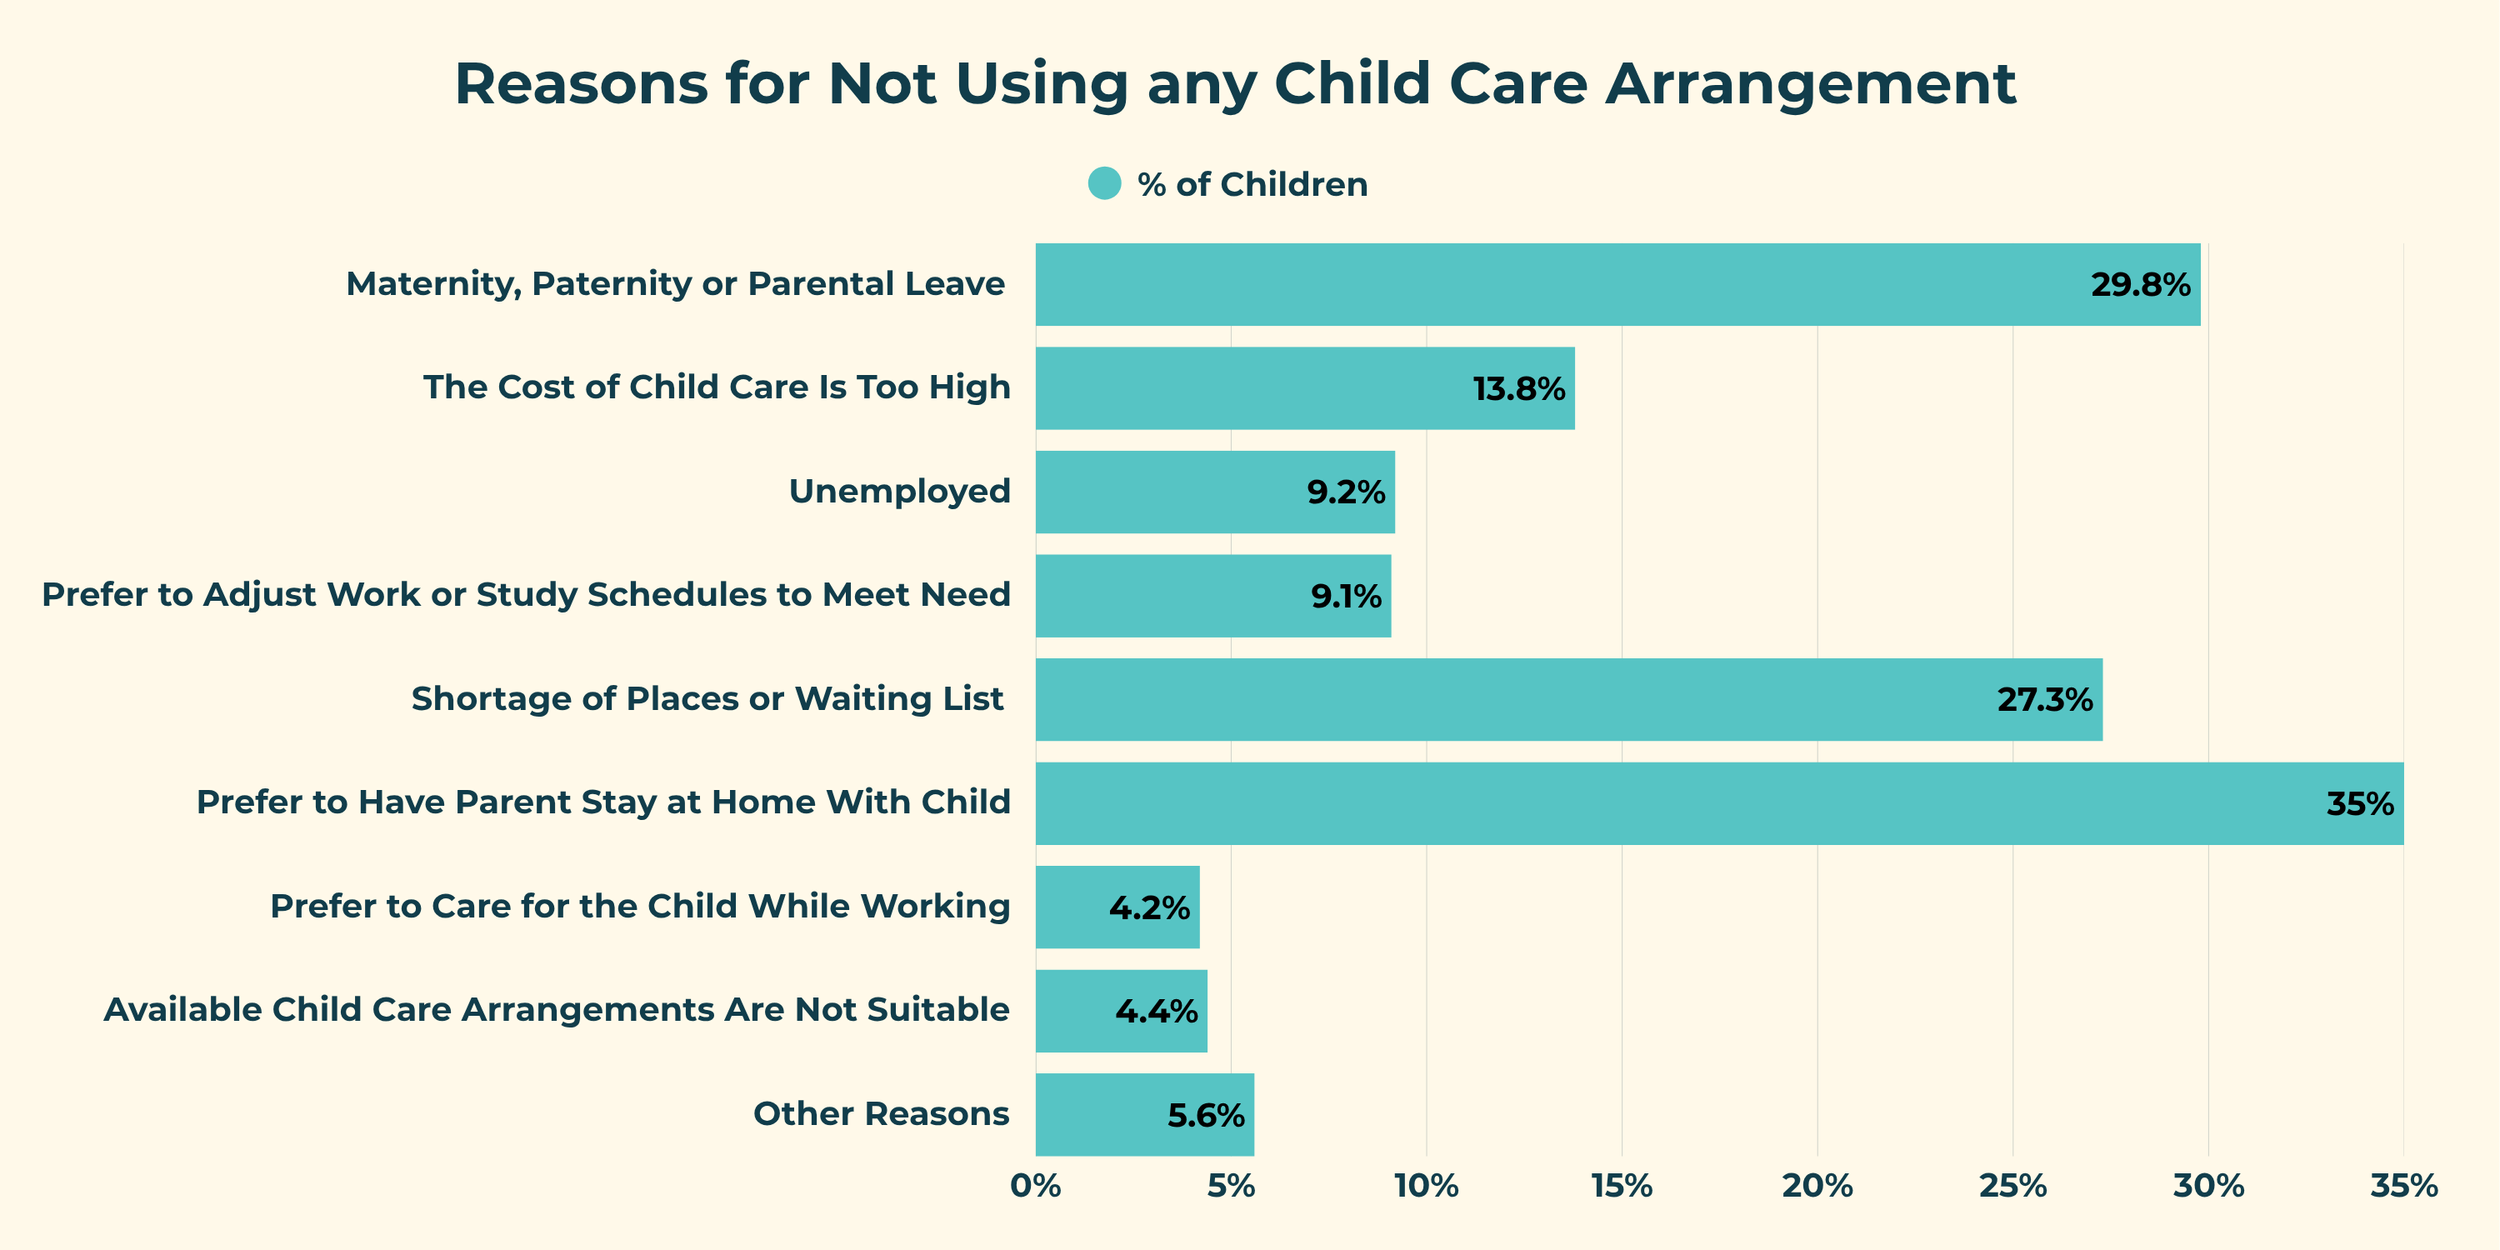
Reasons for not using Child Care
Not every family with a child between the ages of 0 and 5 is seeking child care. Statistics Canada data for New Brunswick shows that families have a variety of reasons for their children not using formal child care.

Core Housing Need
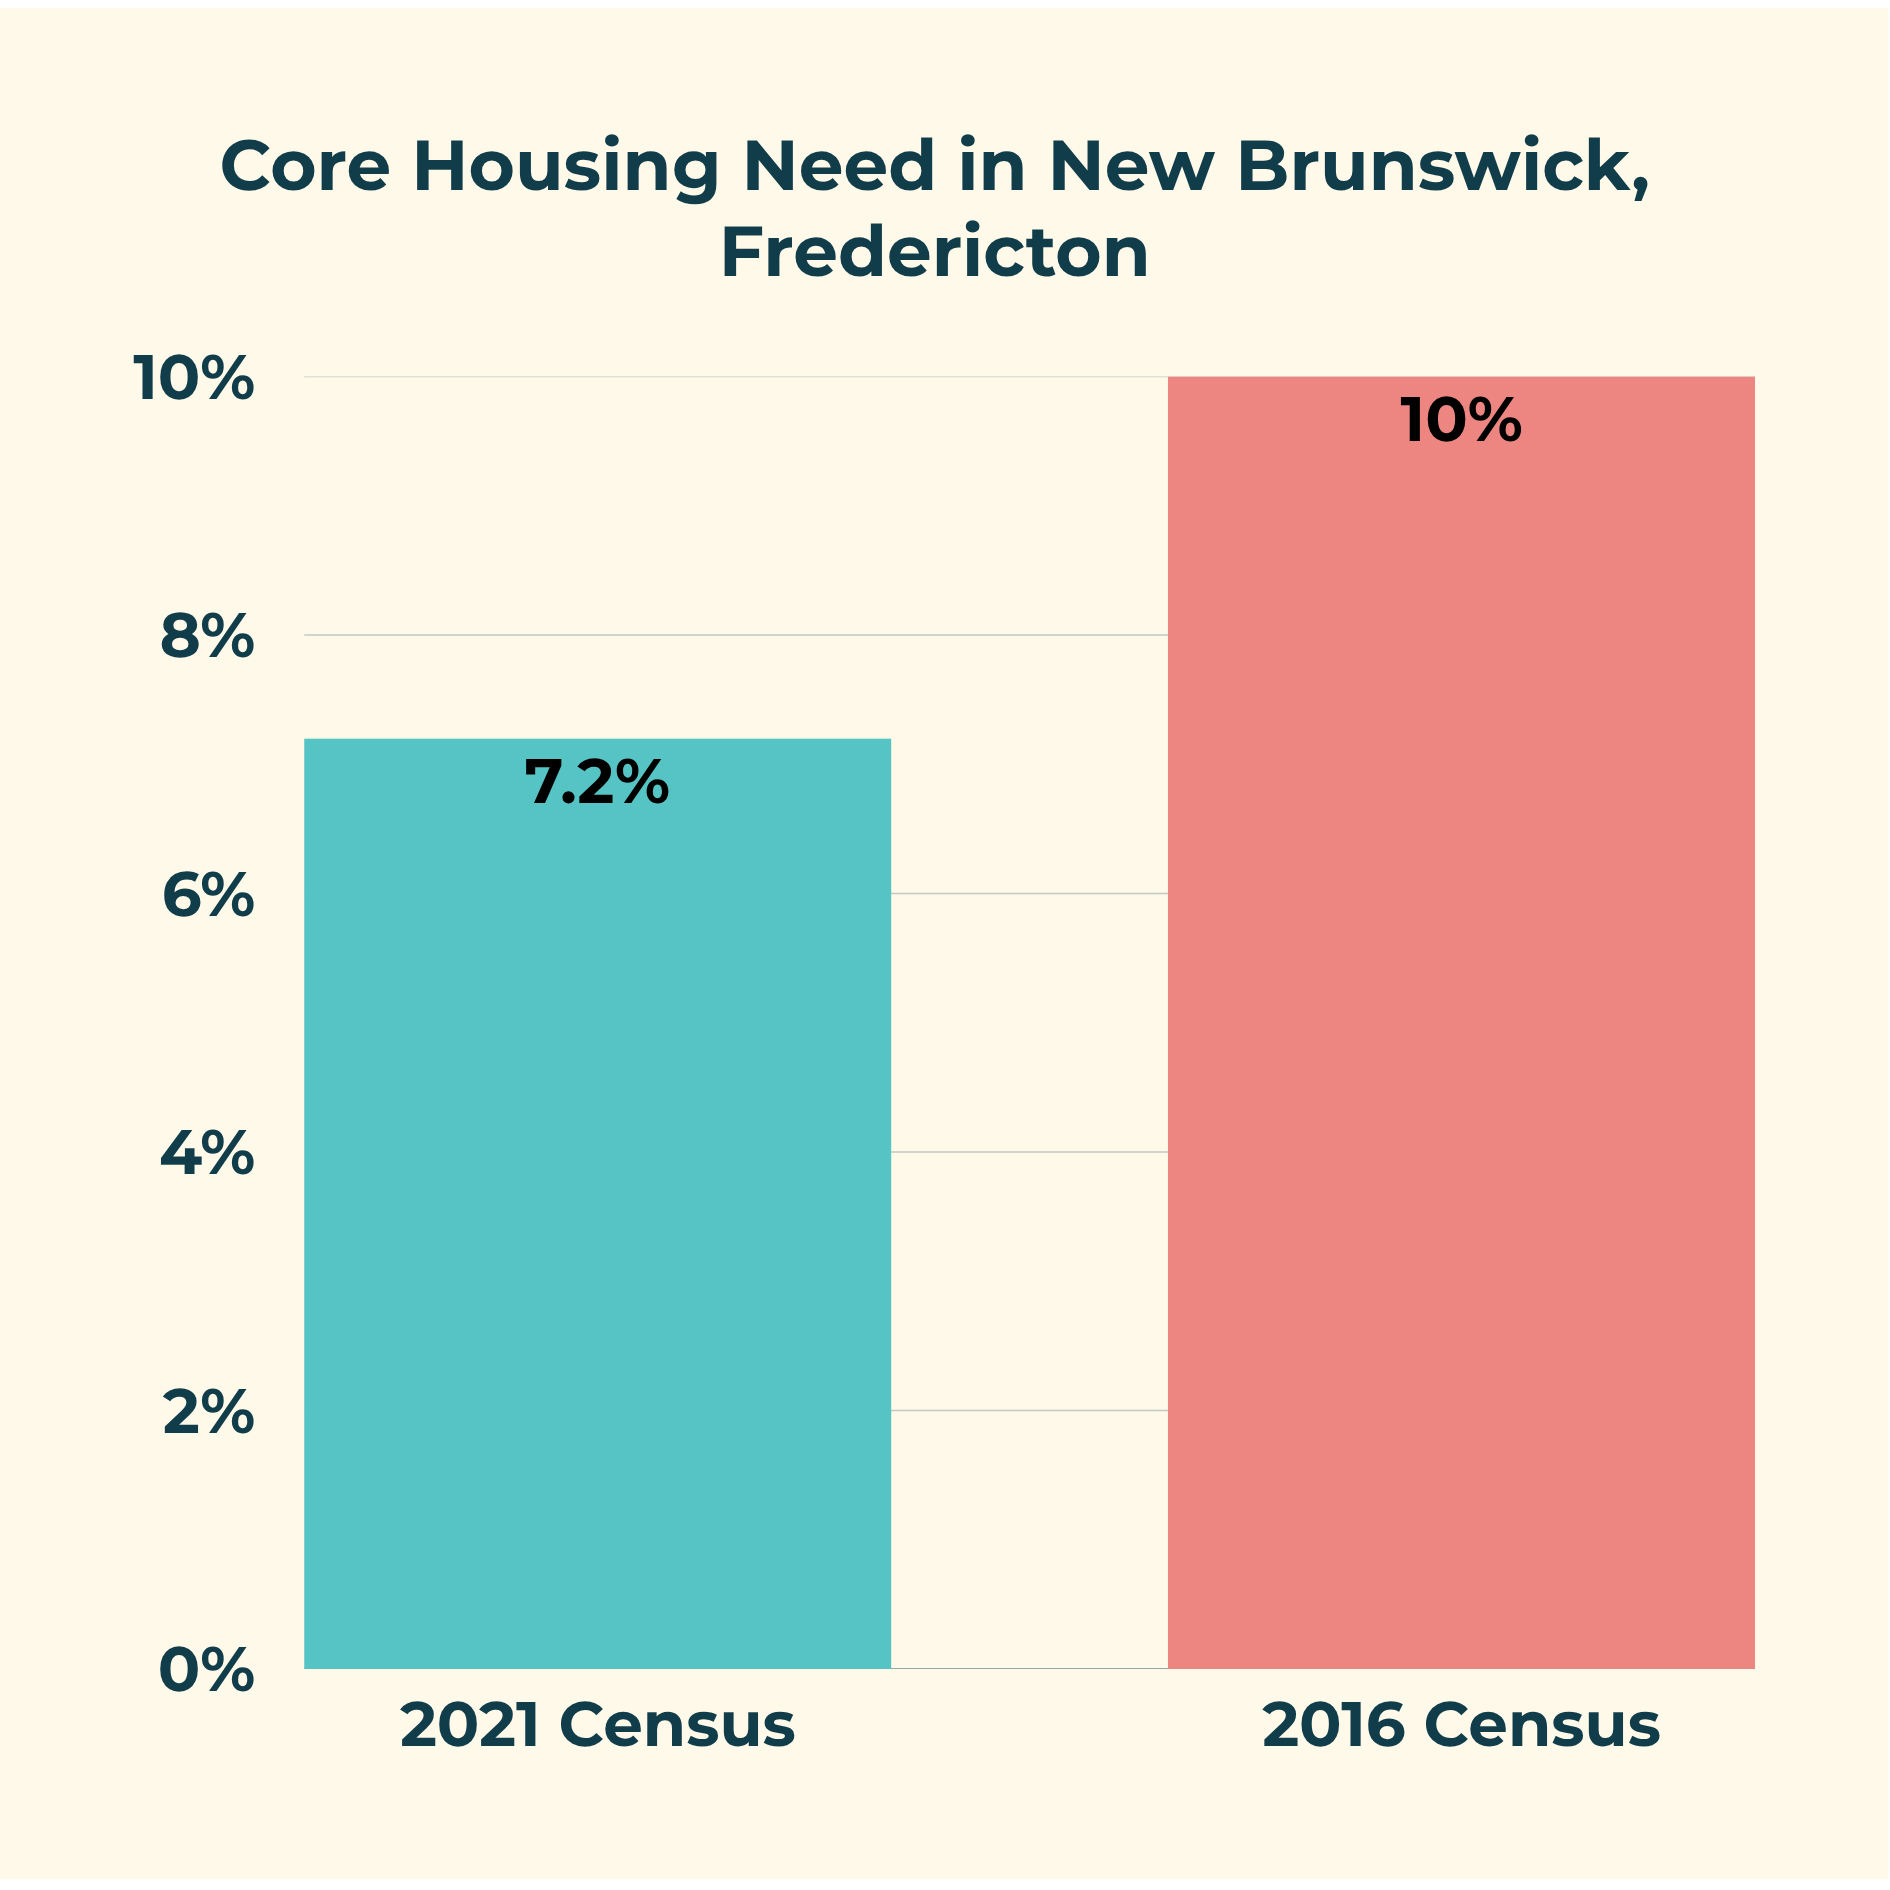
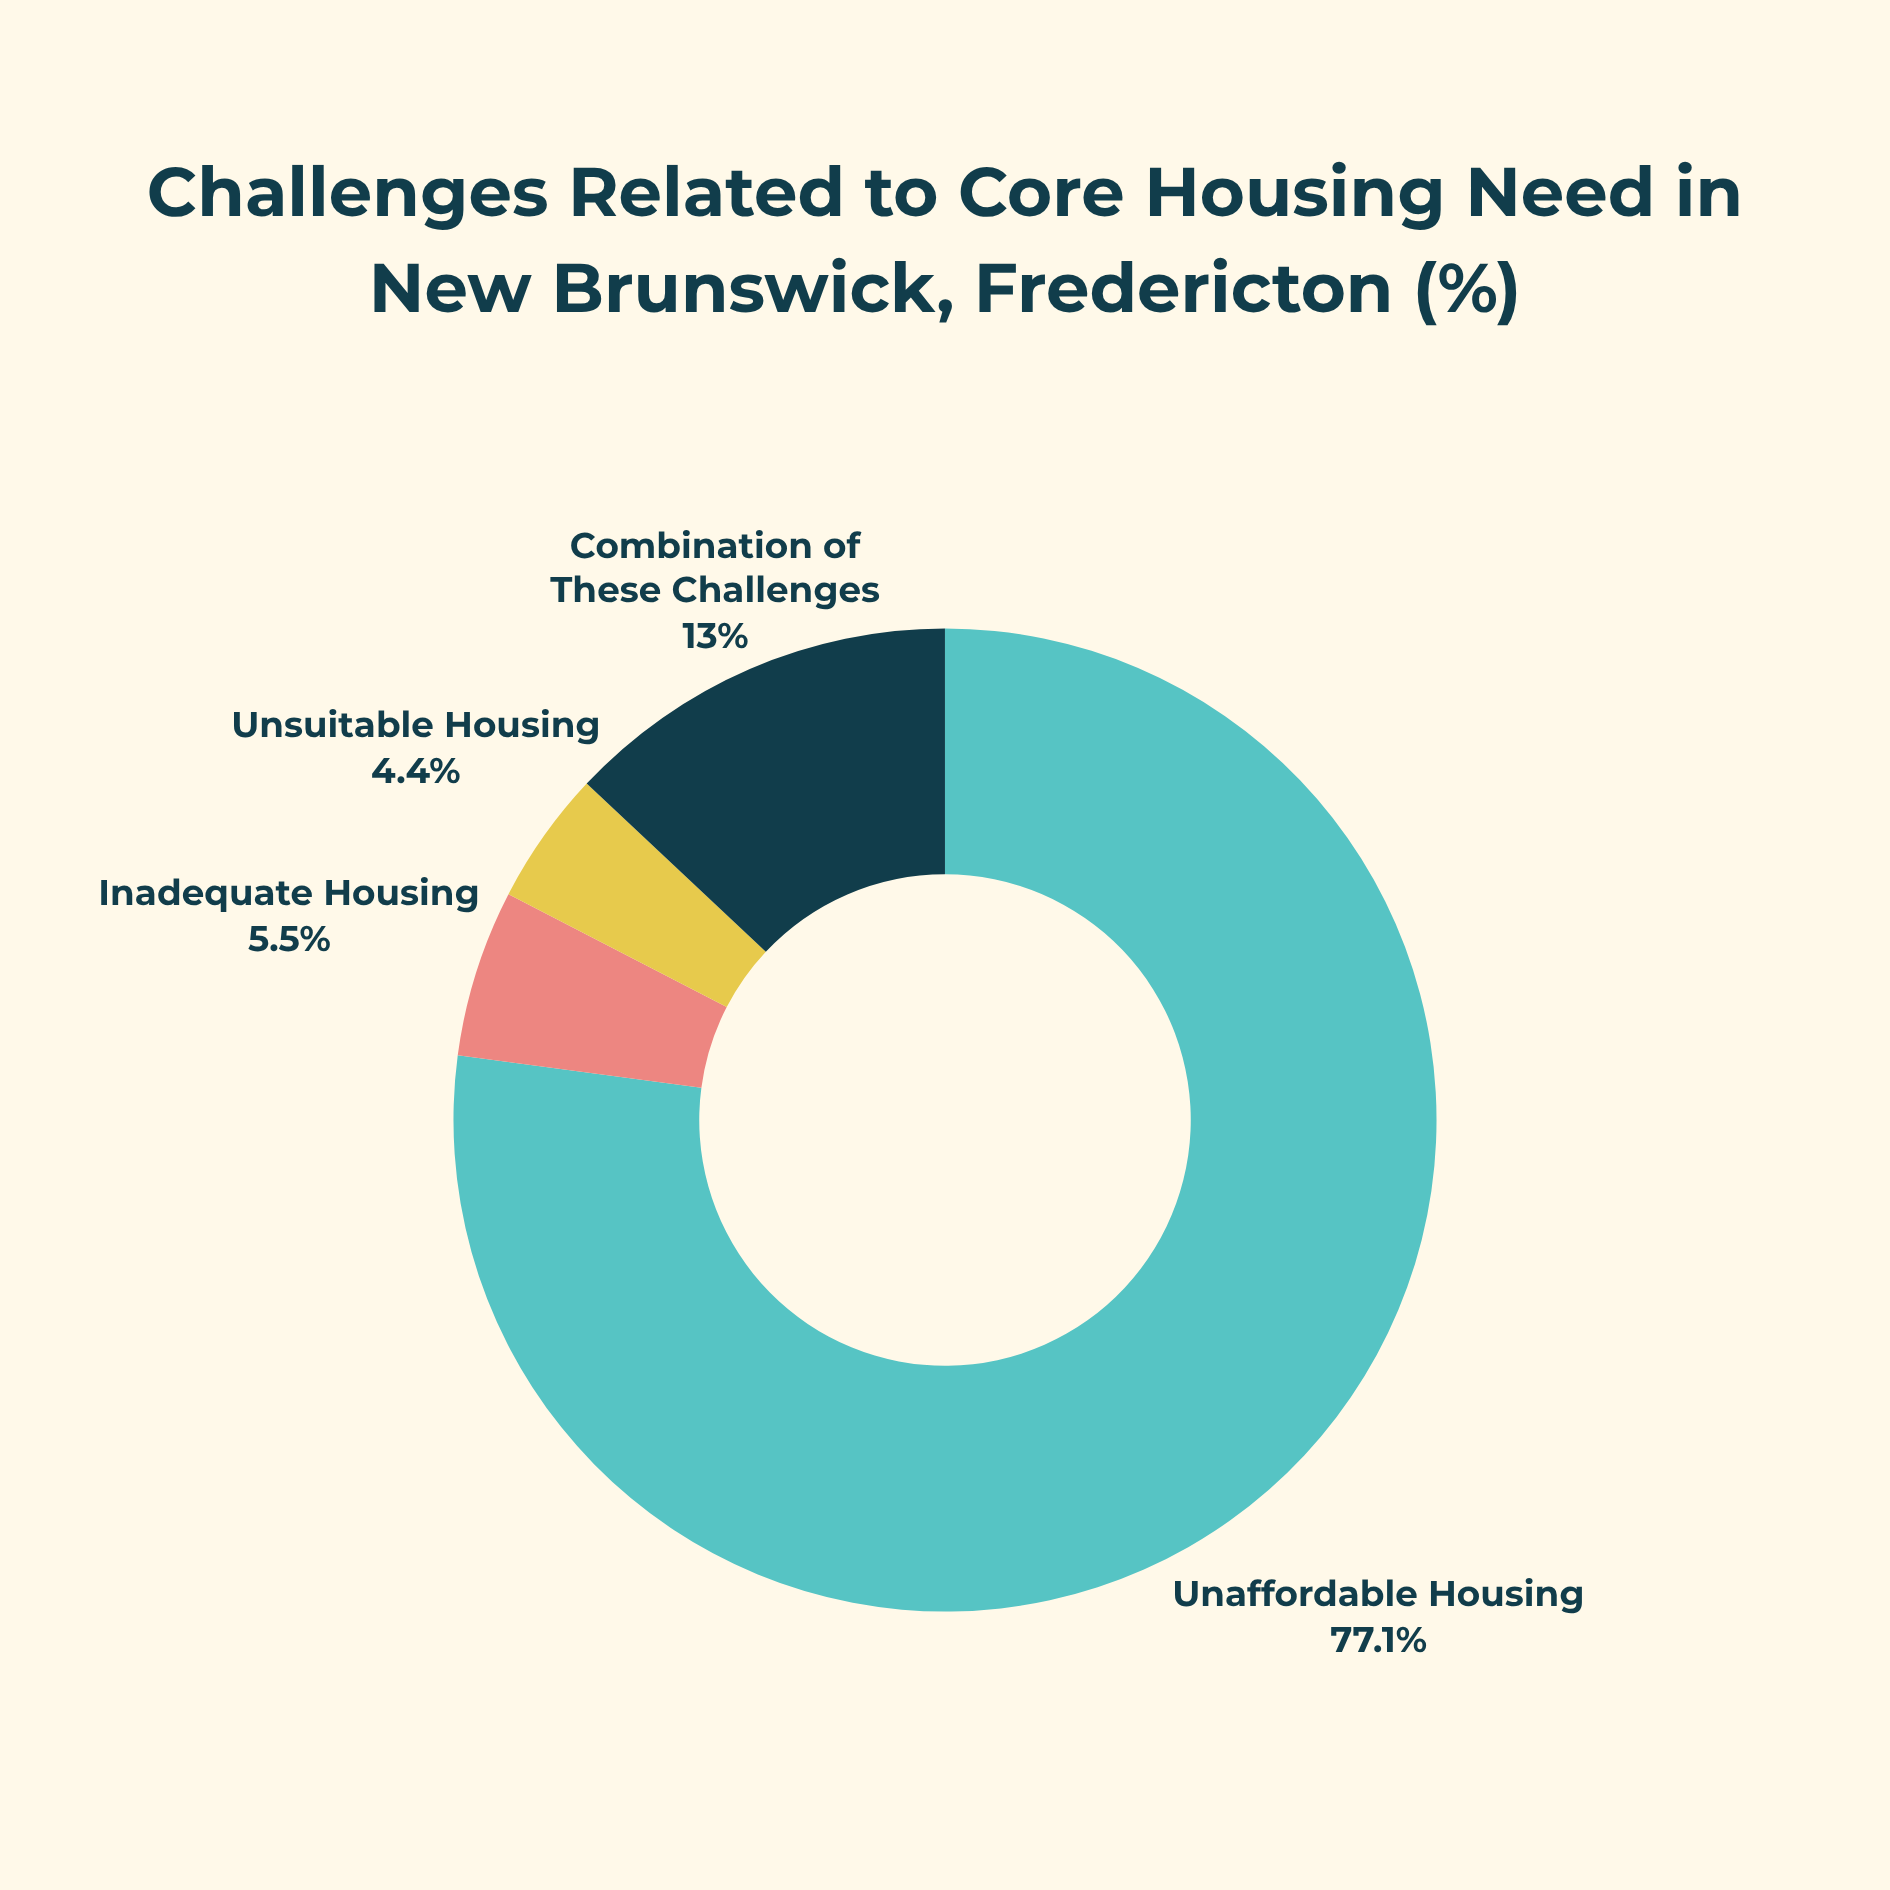
Core housing need refers to households living in housing that is unaffordable, unsuitable, or in need of major repairs, and who cannot afford acceptable alternative housing in their local market.
It is measured using Statistics Canada Census data collected every five years, with the most recent results from the 2021 Census data and the next update expected following the 2026 Census. Acceptable housing is adequate in condition, suitable in size, and affordable.
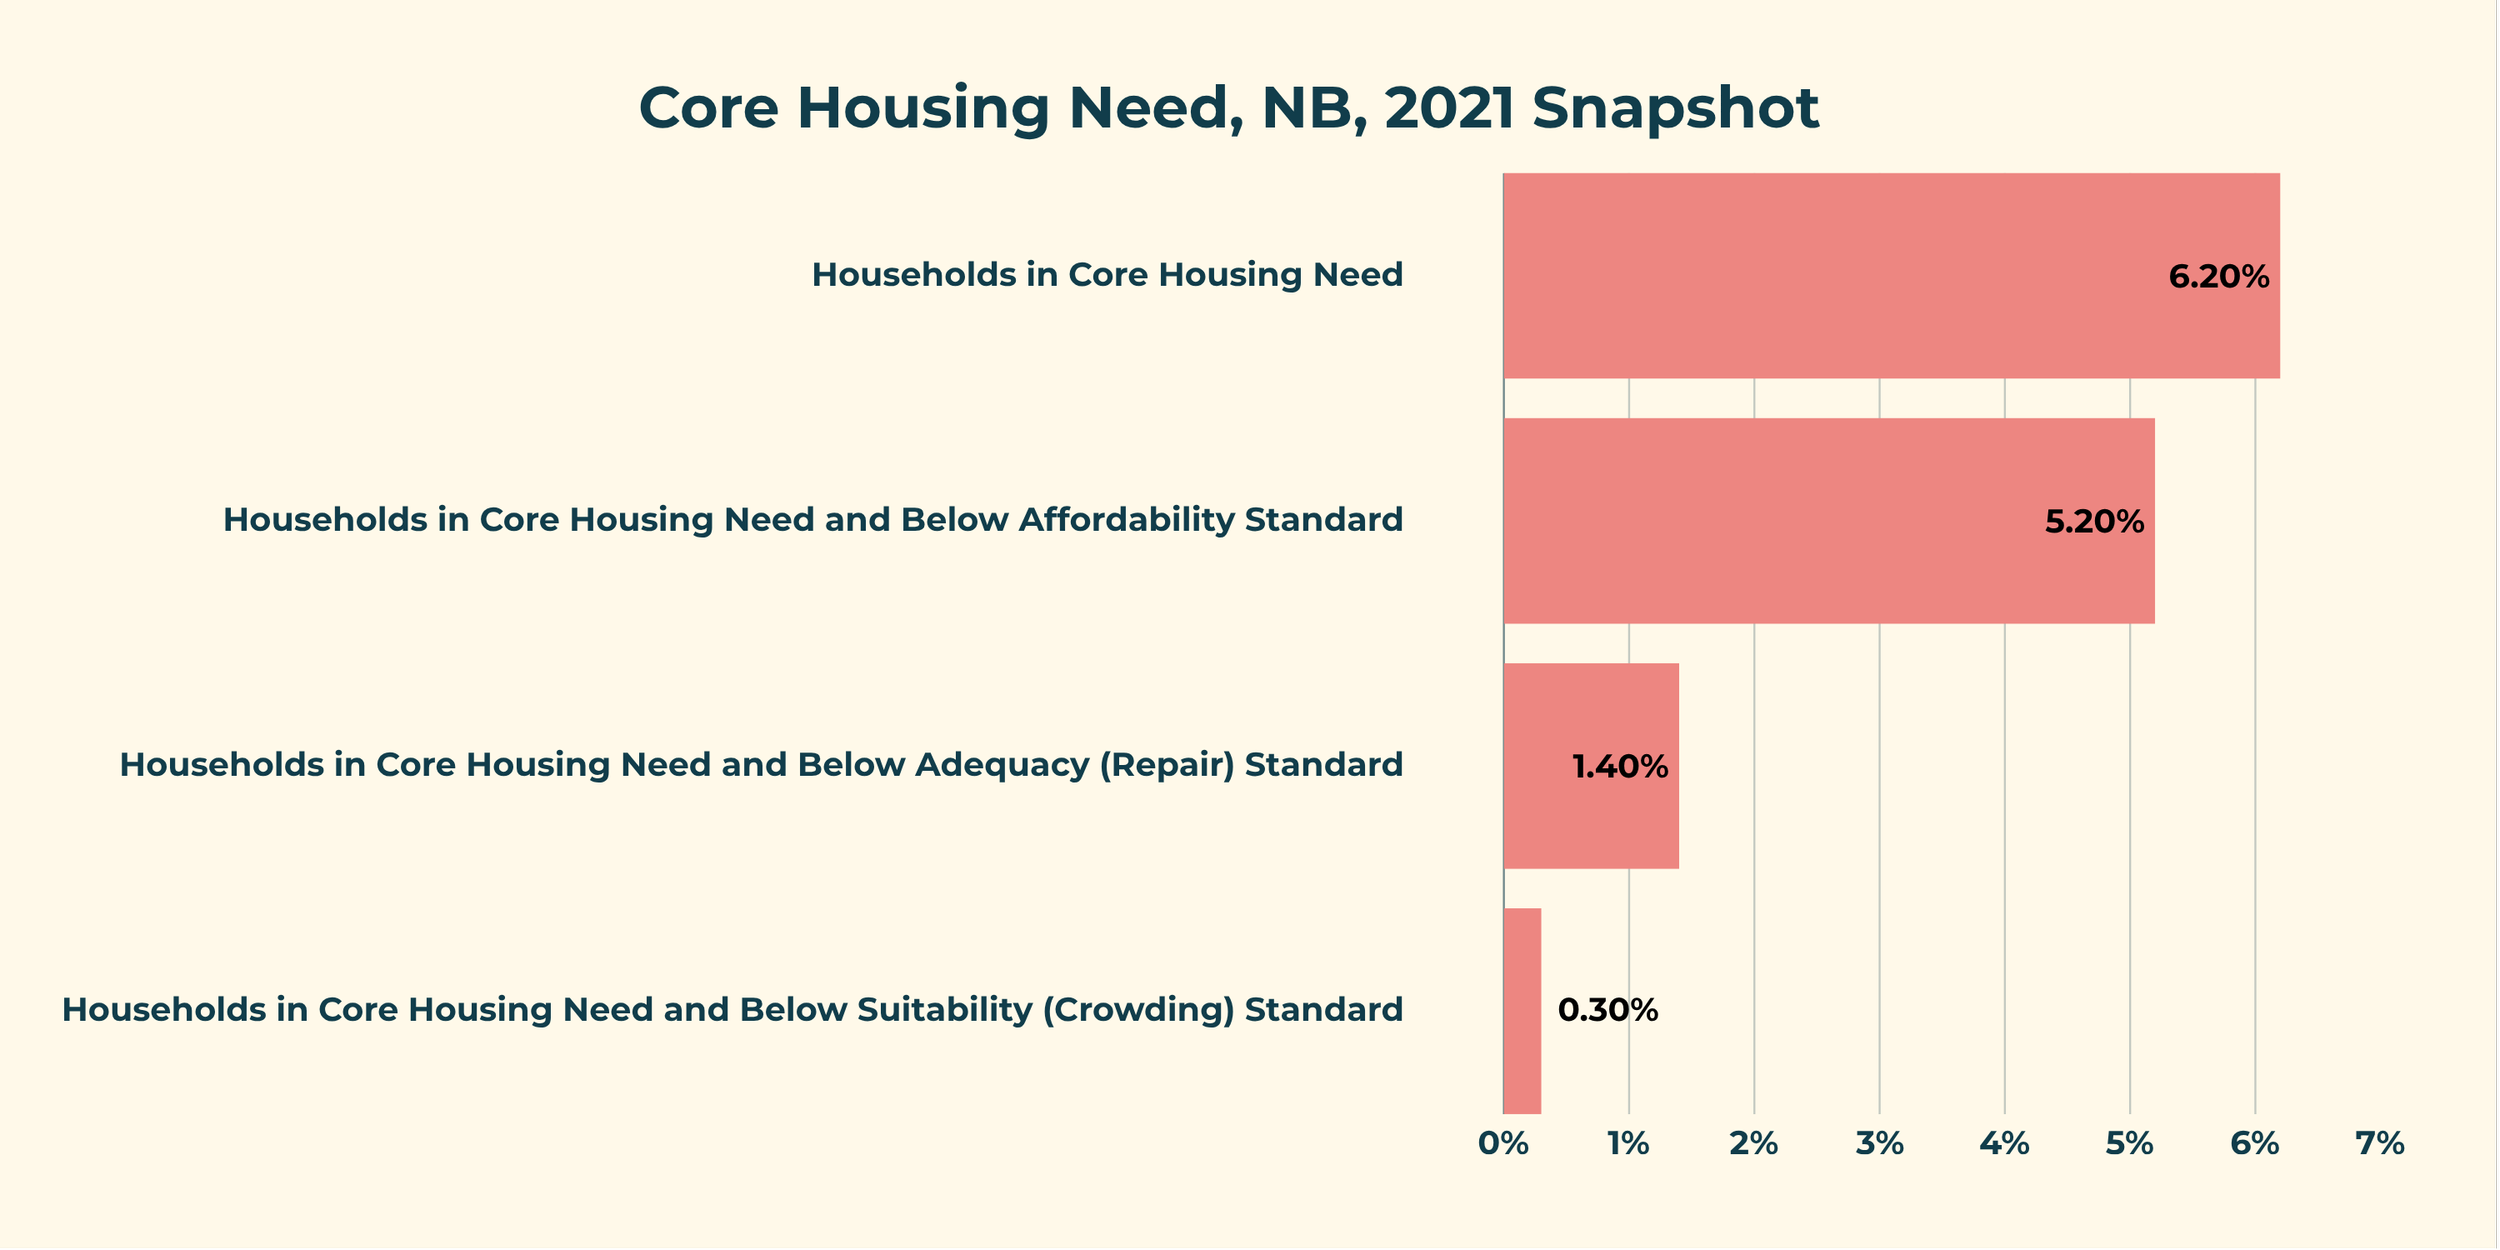
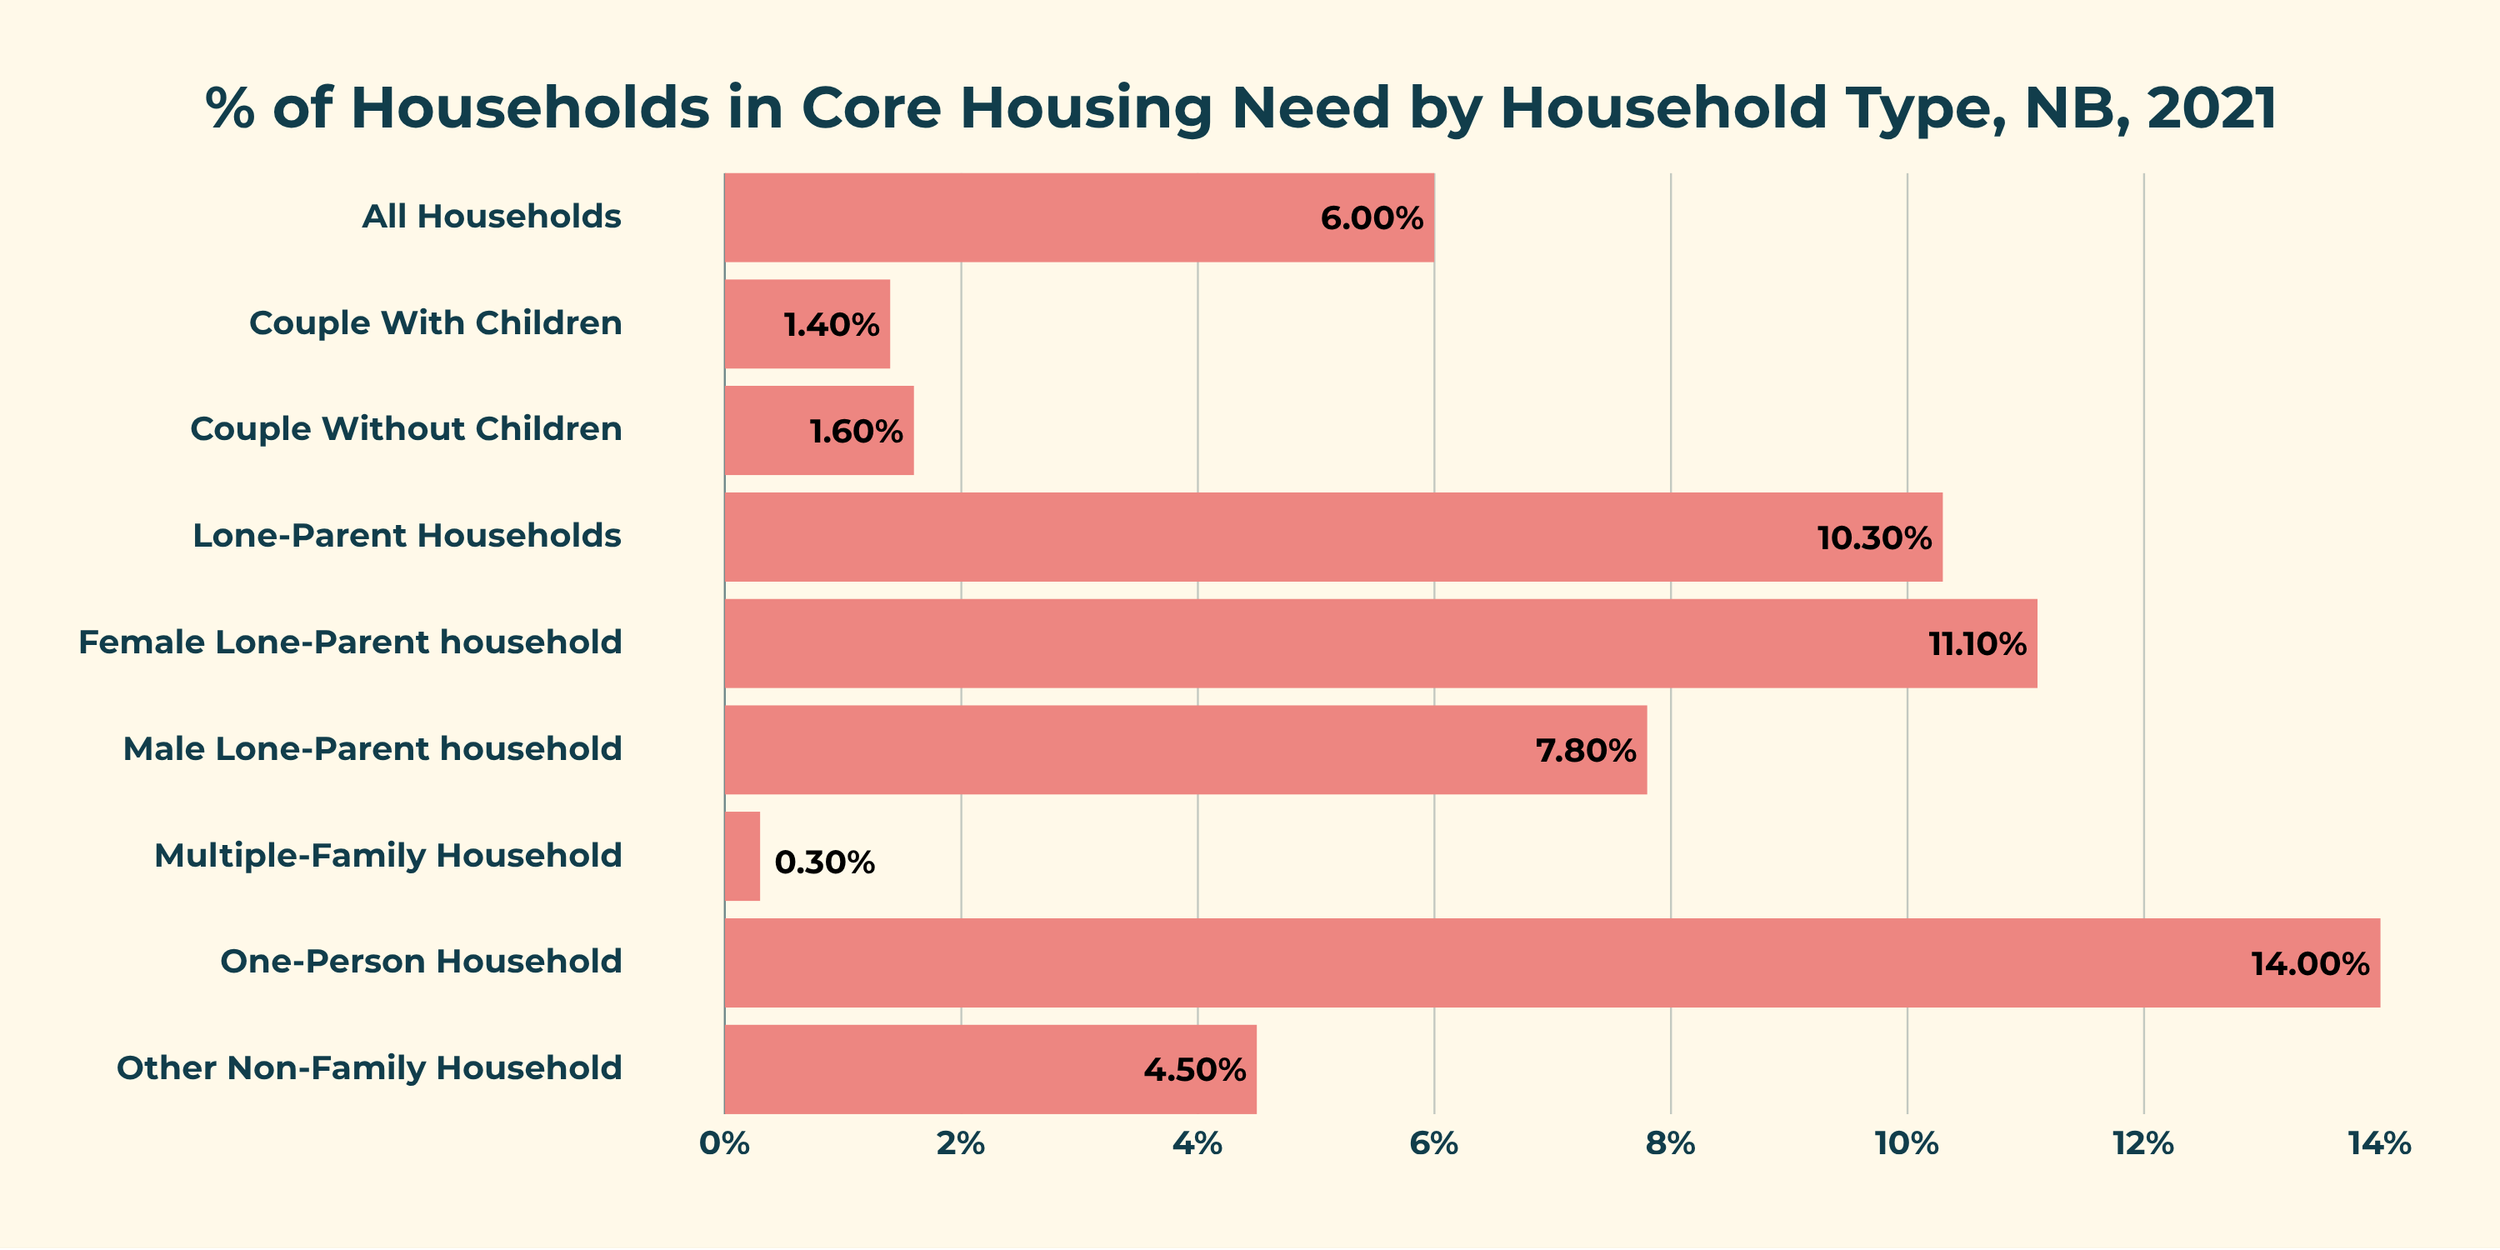
In New Brunswick, core housing need is concentrated among one-person and lone-parent households.
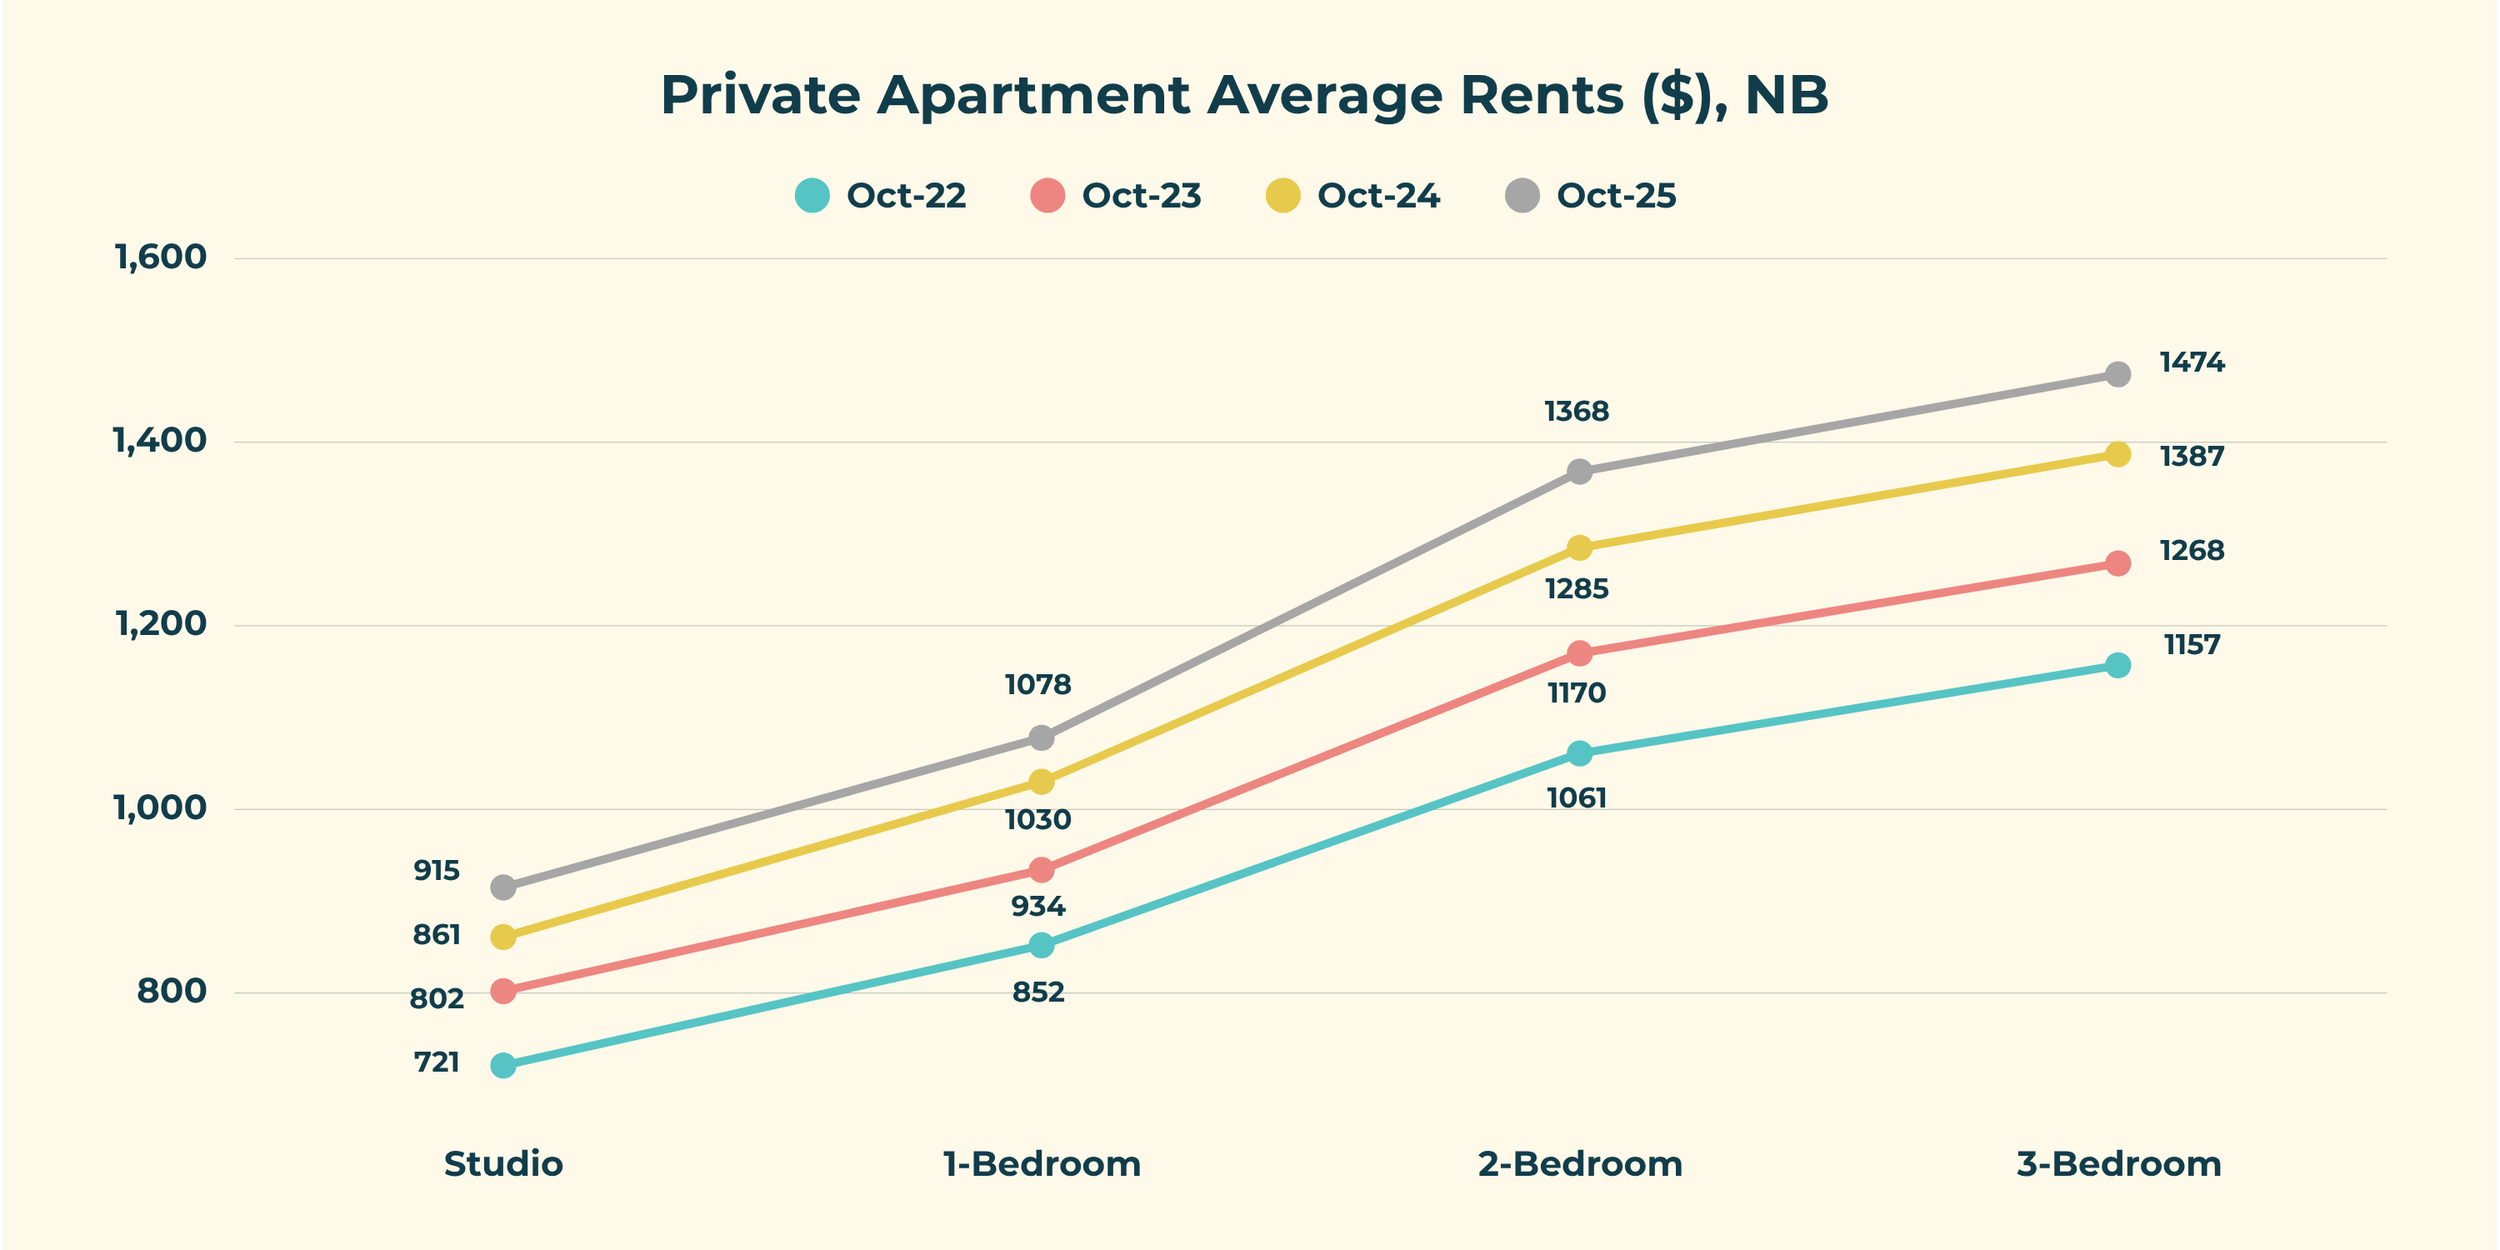
In 2025, the hourly wage needed to afford the average 3-bedroom rental in NB was approximately $28.35 per hour.
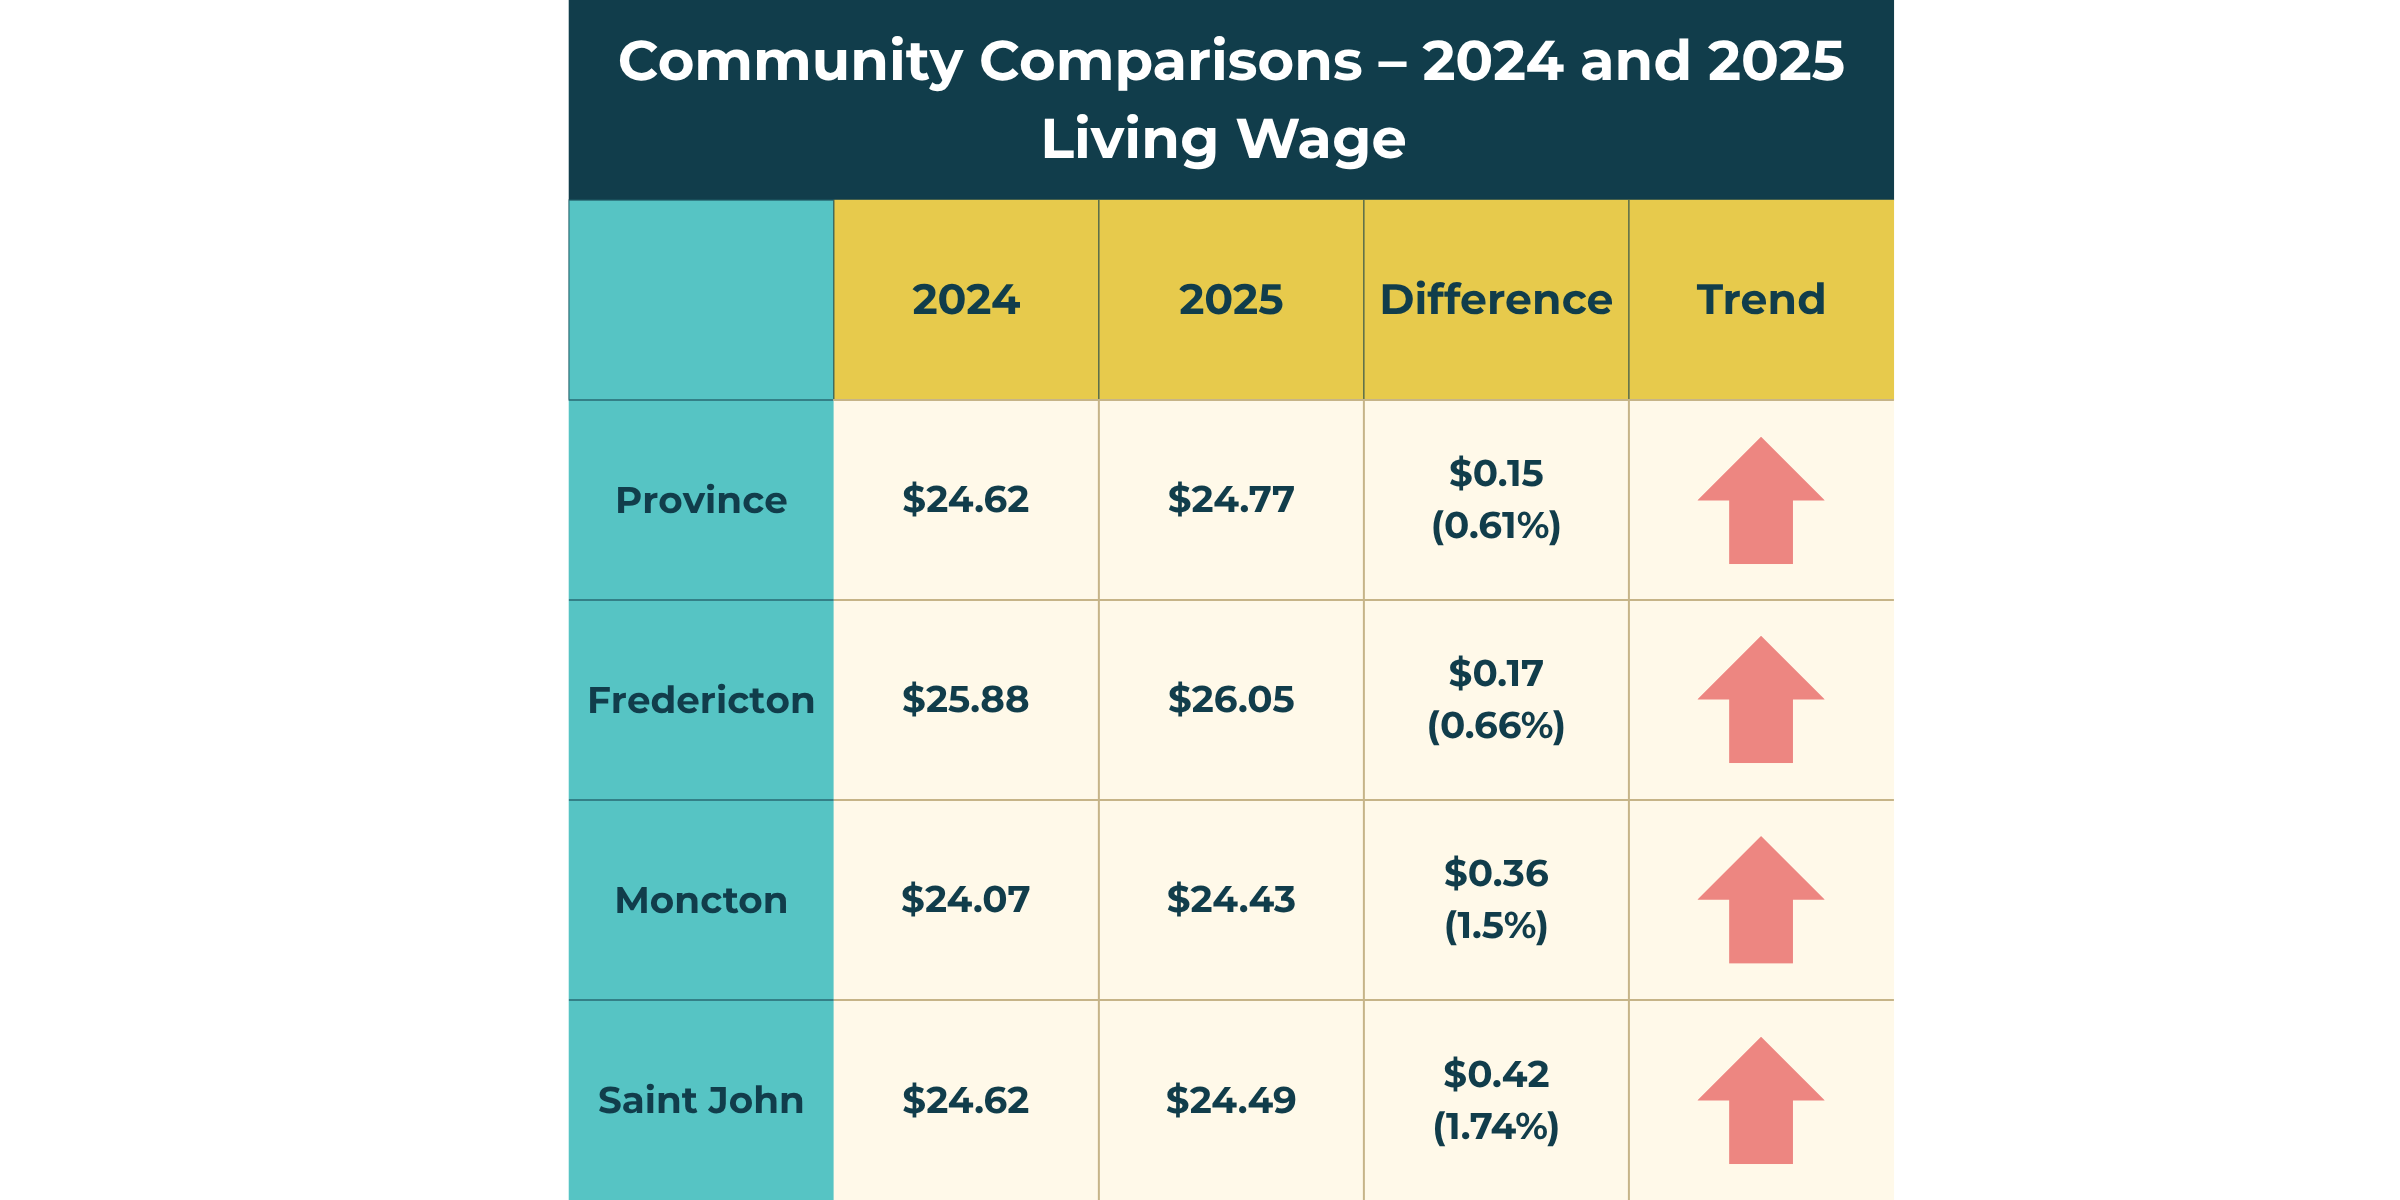
This calculation assumes full-time employment and that no more than 30% of income is spent on housing. The average living wage in NB in 2025 was $24.77 per hour, meaning that even workers earning a living wage would face challenges affording the average 3-bedroom rental without exceeding the commonly accepted affordability threshold.
The Market Basket Measure reference family consists of two adults and two children. Highlighting the costs and affordability of 3-bedroom housing is important, as this is generally considered an appropriate housing size for a family of that composition.
Living Wage
New Brunswick has the third lowest minimum wage in Canada, at $15.90. Only above Alberta and Saskatchewan.
A living wage, however, is not the same as a minimum wage. It also is not a guaranteed annual income. It is defined as the hourly wage a worker needs to earn to cover their basic expenses and participate in their community.
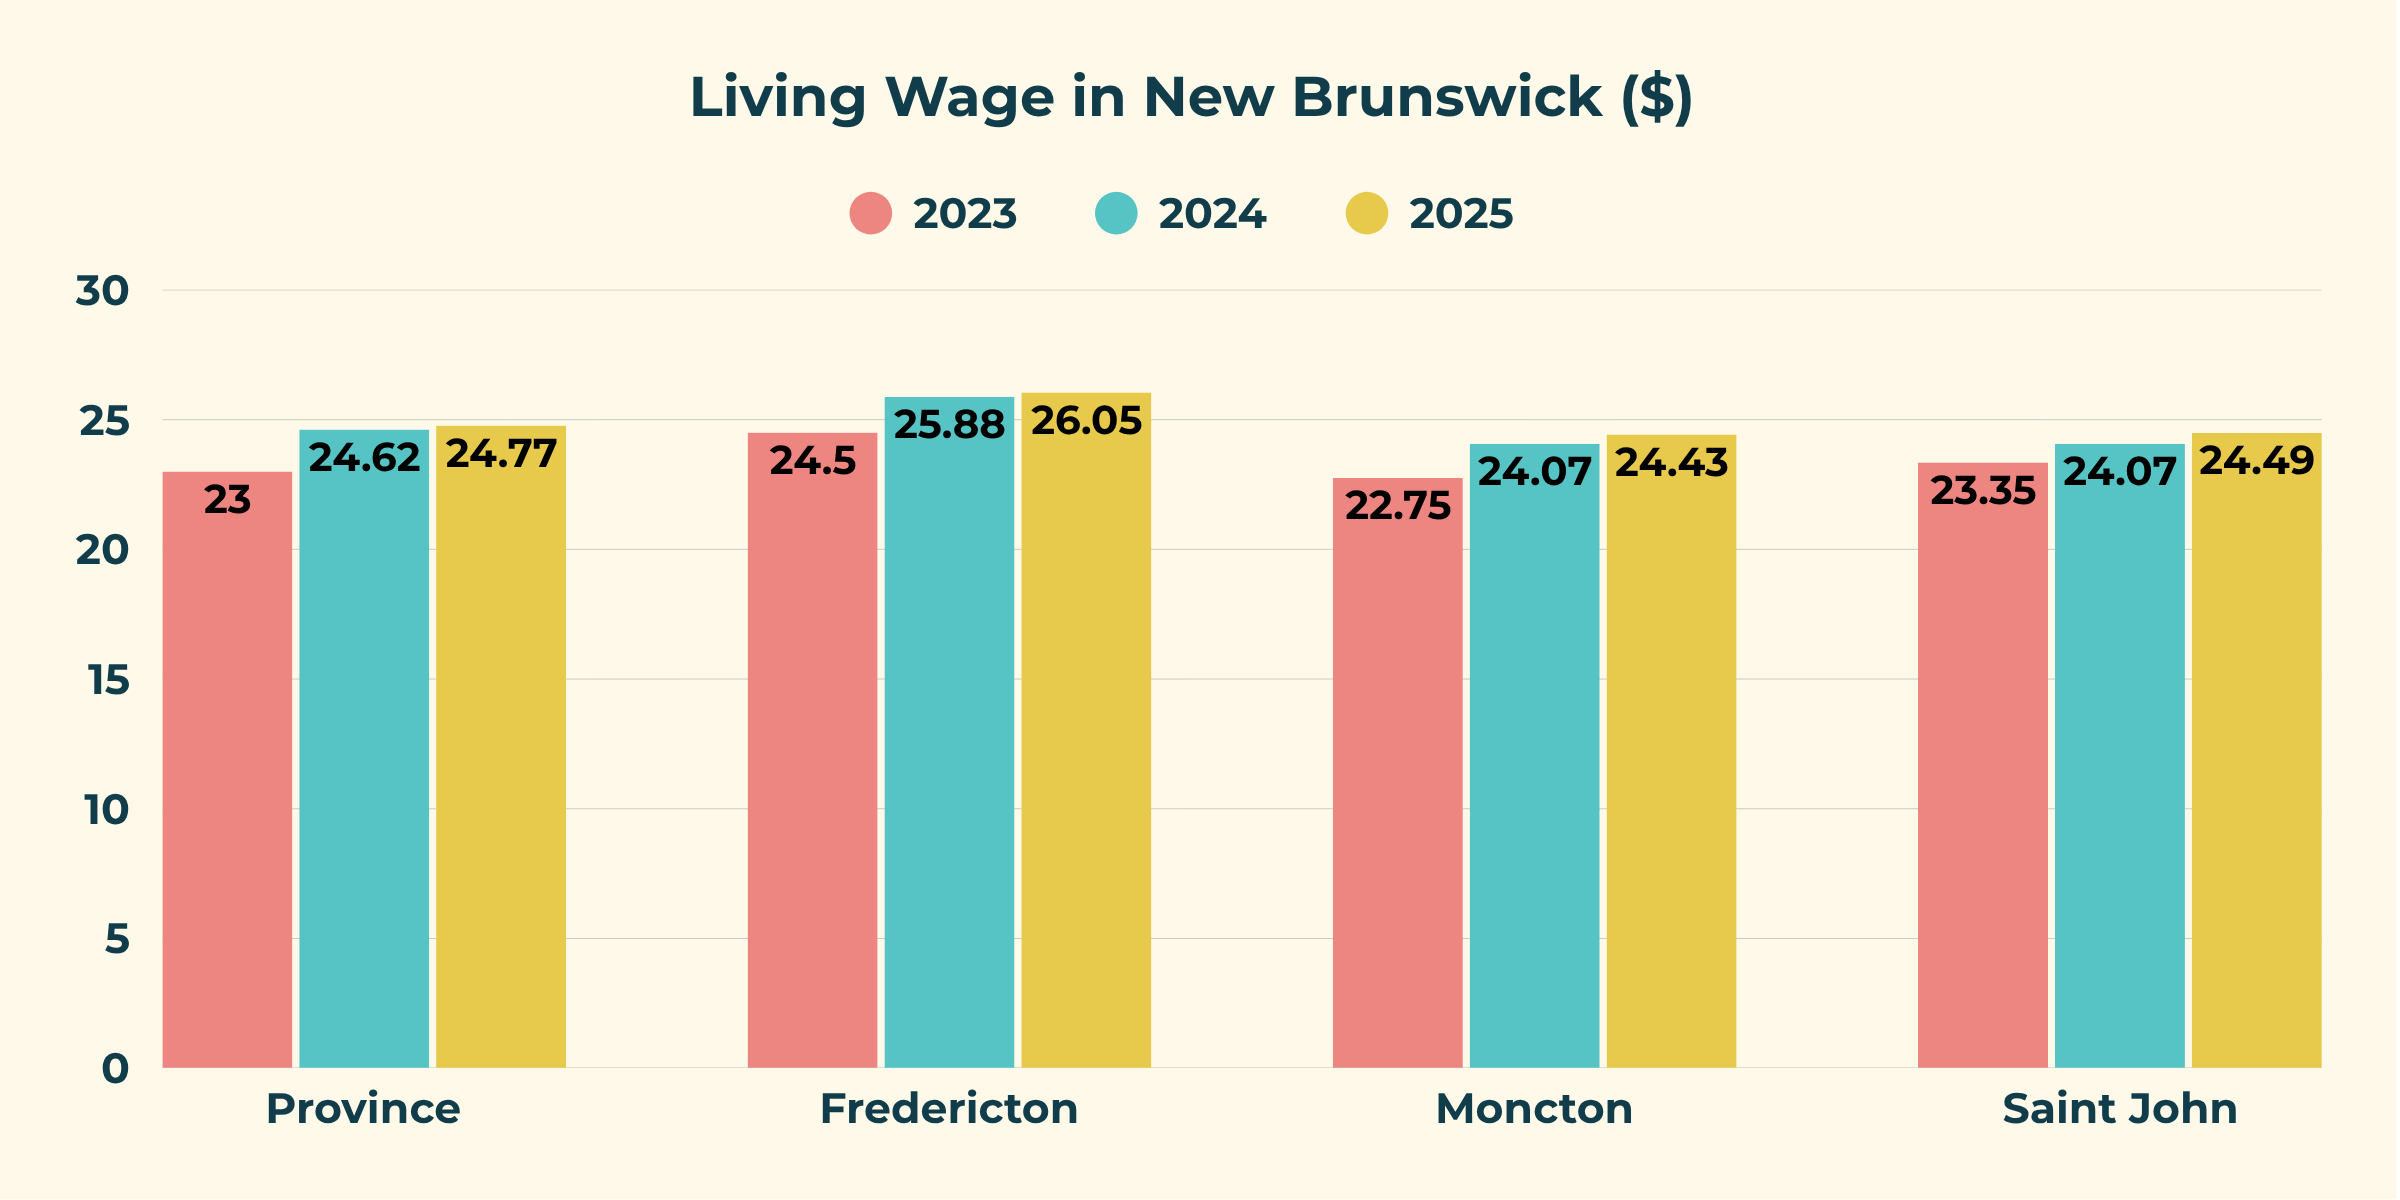
In New Brunswick, the gap between the minimum wage and the living wage is $8.87, or about 36% lower than what is considered necessary to meet basic household needs and participate in community life.
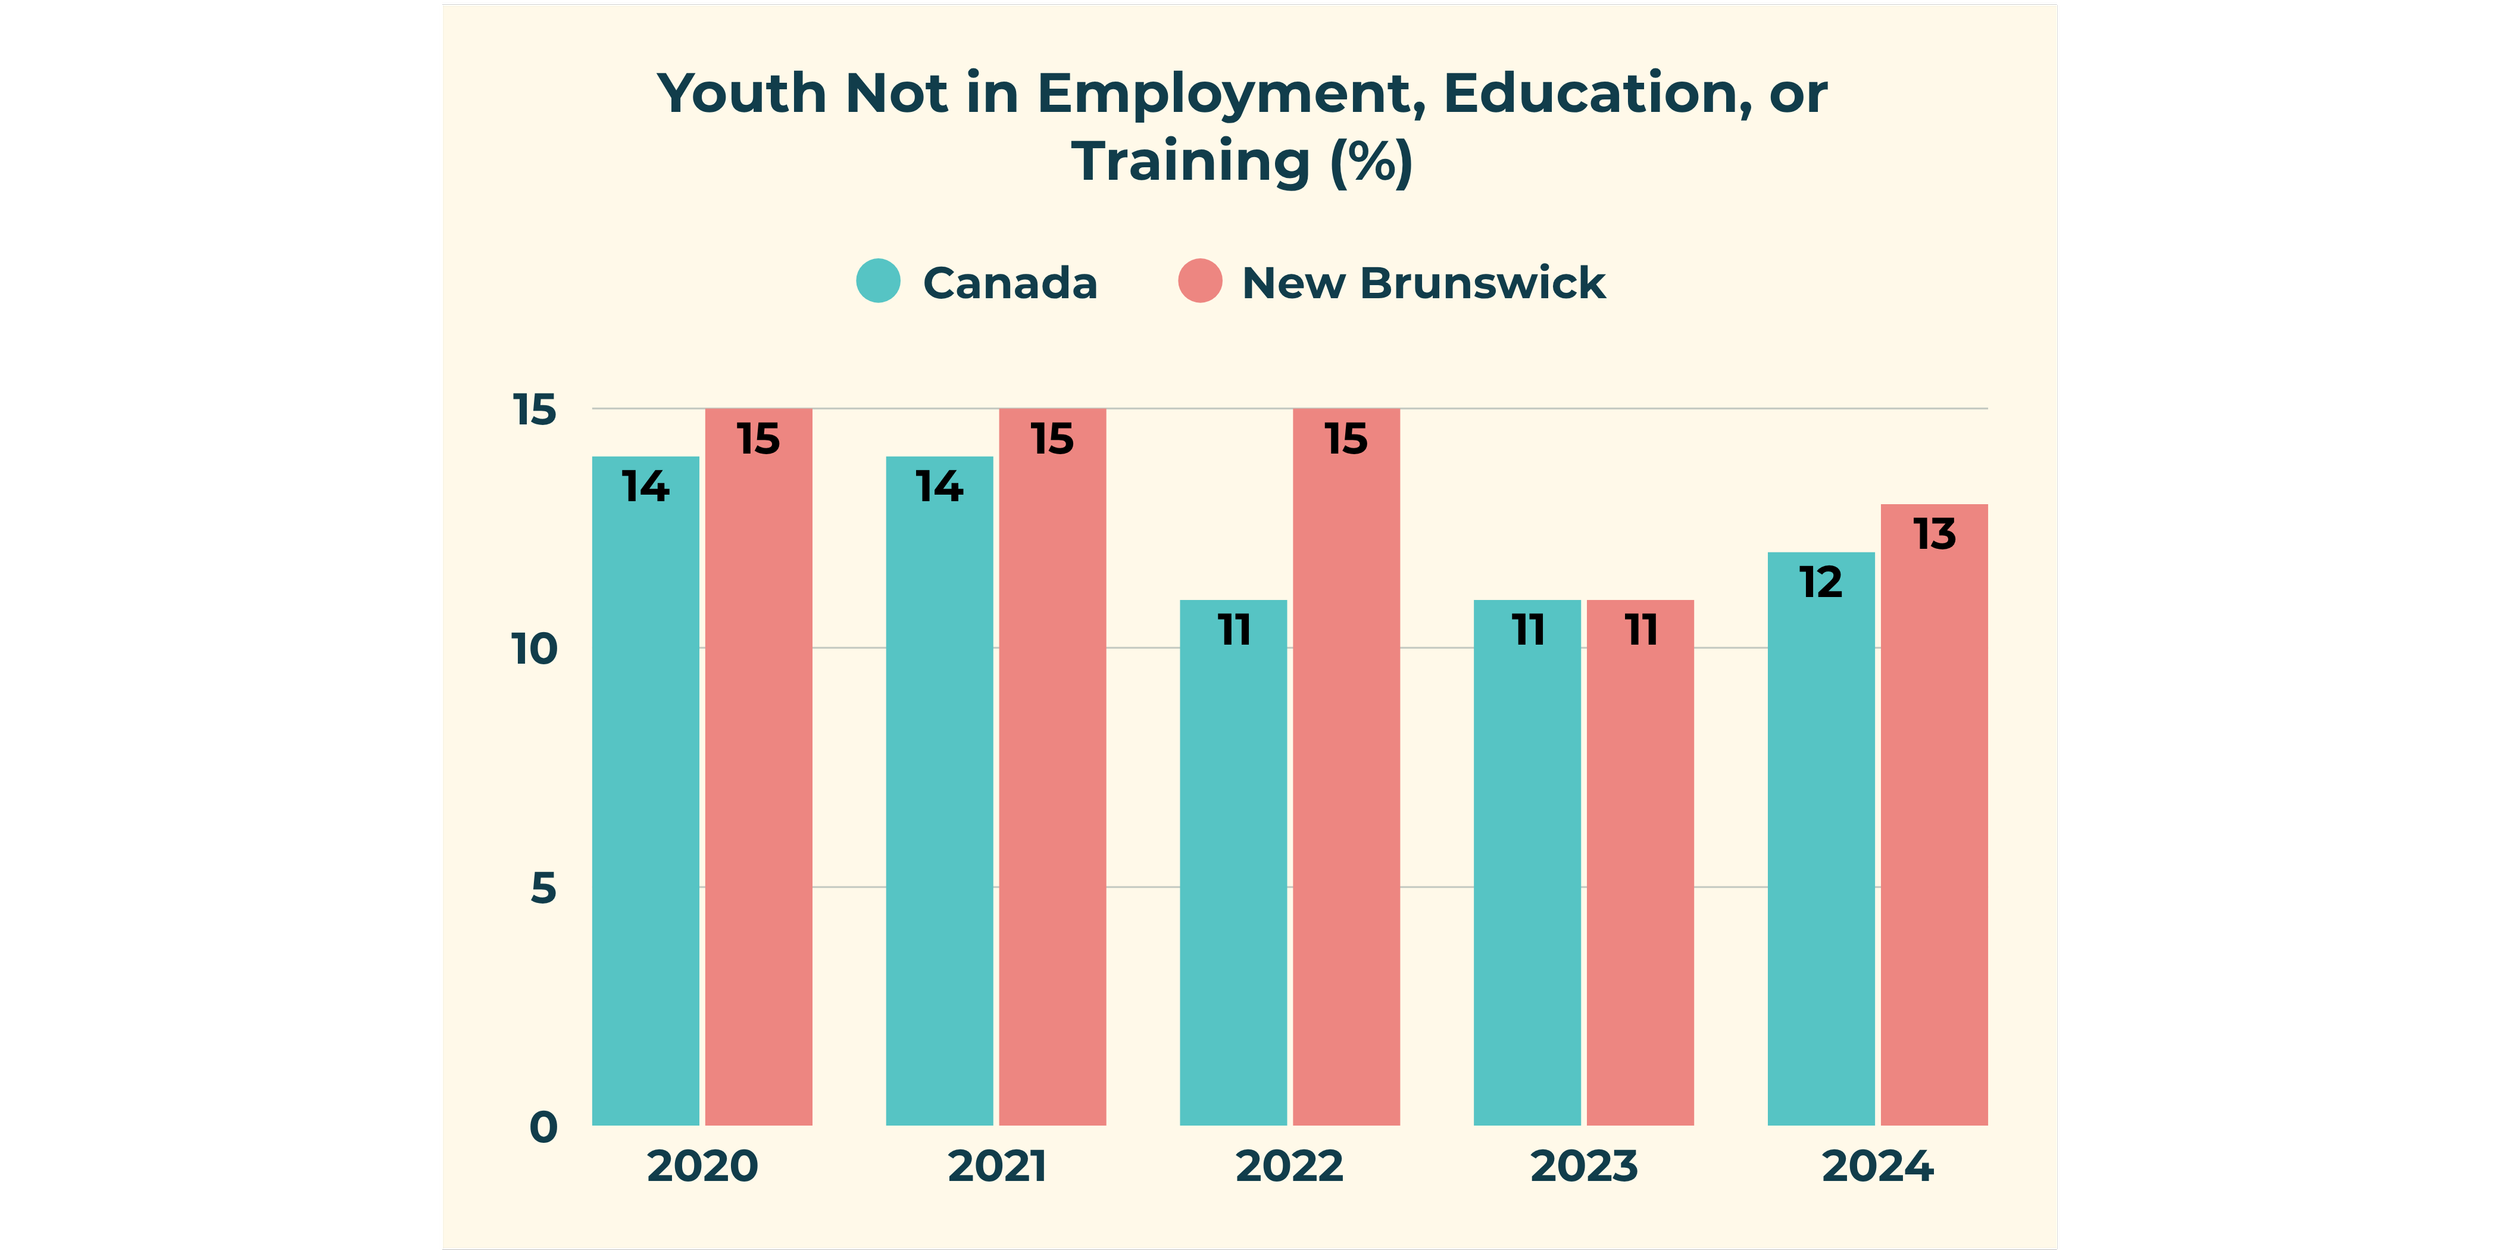
Youth not in Employment, Education, or Training (NEET)
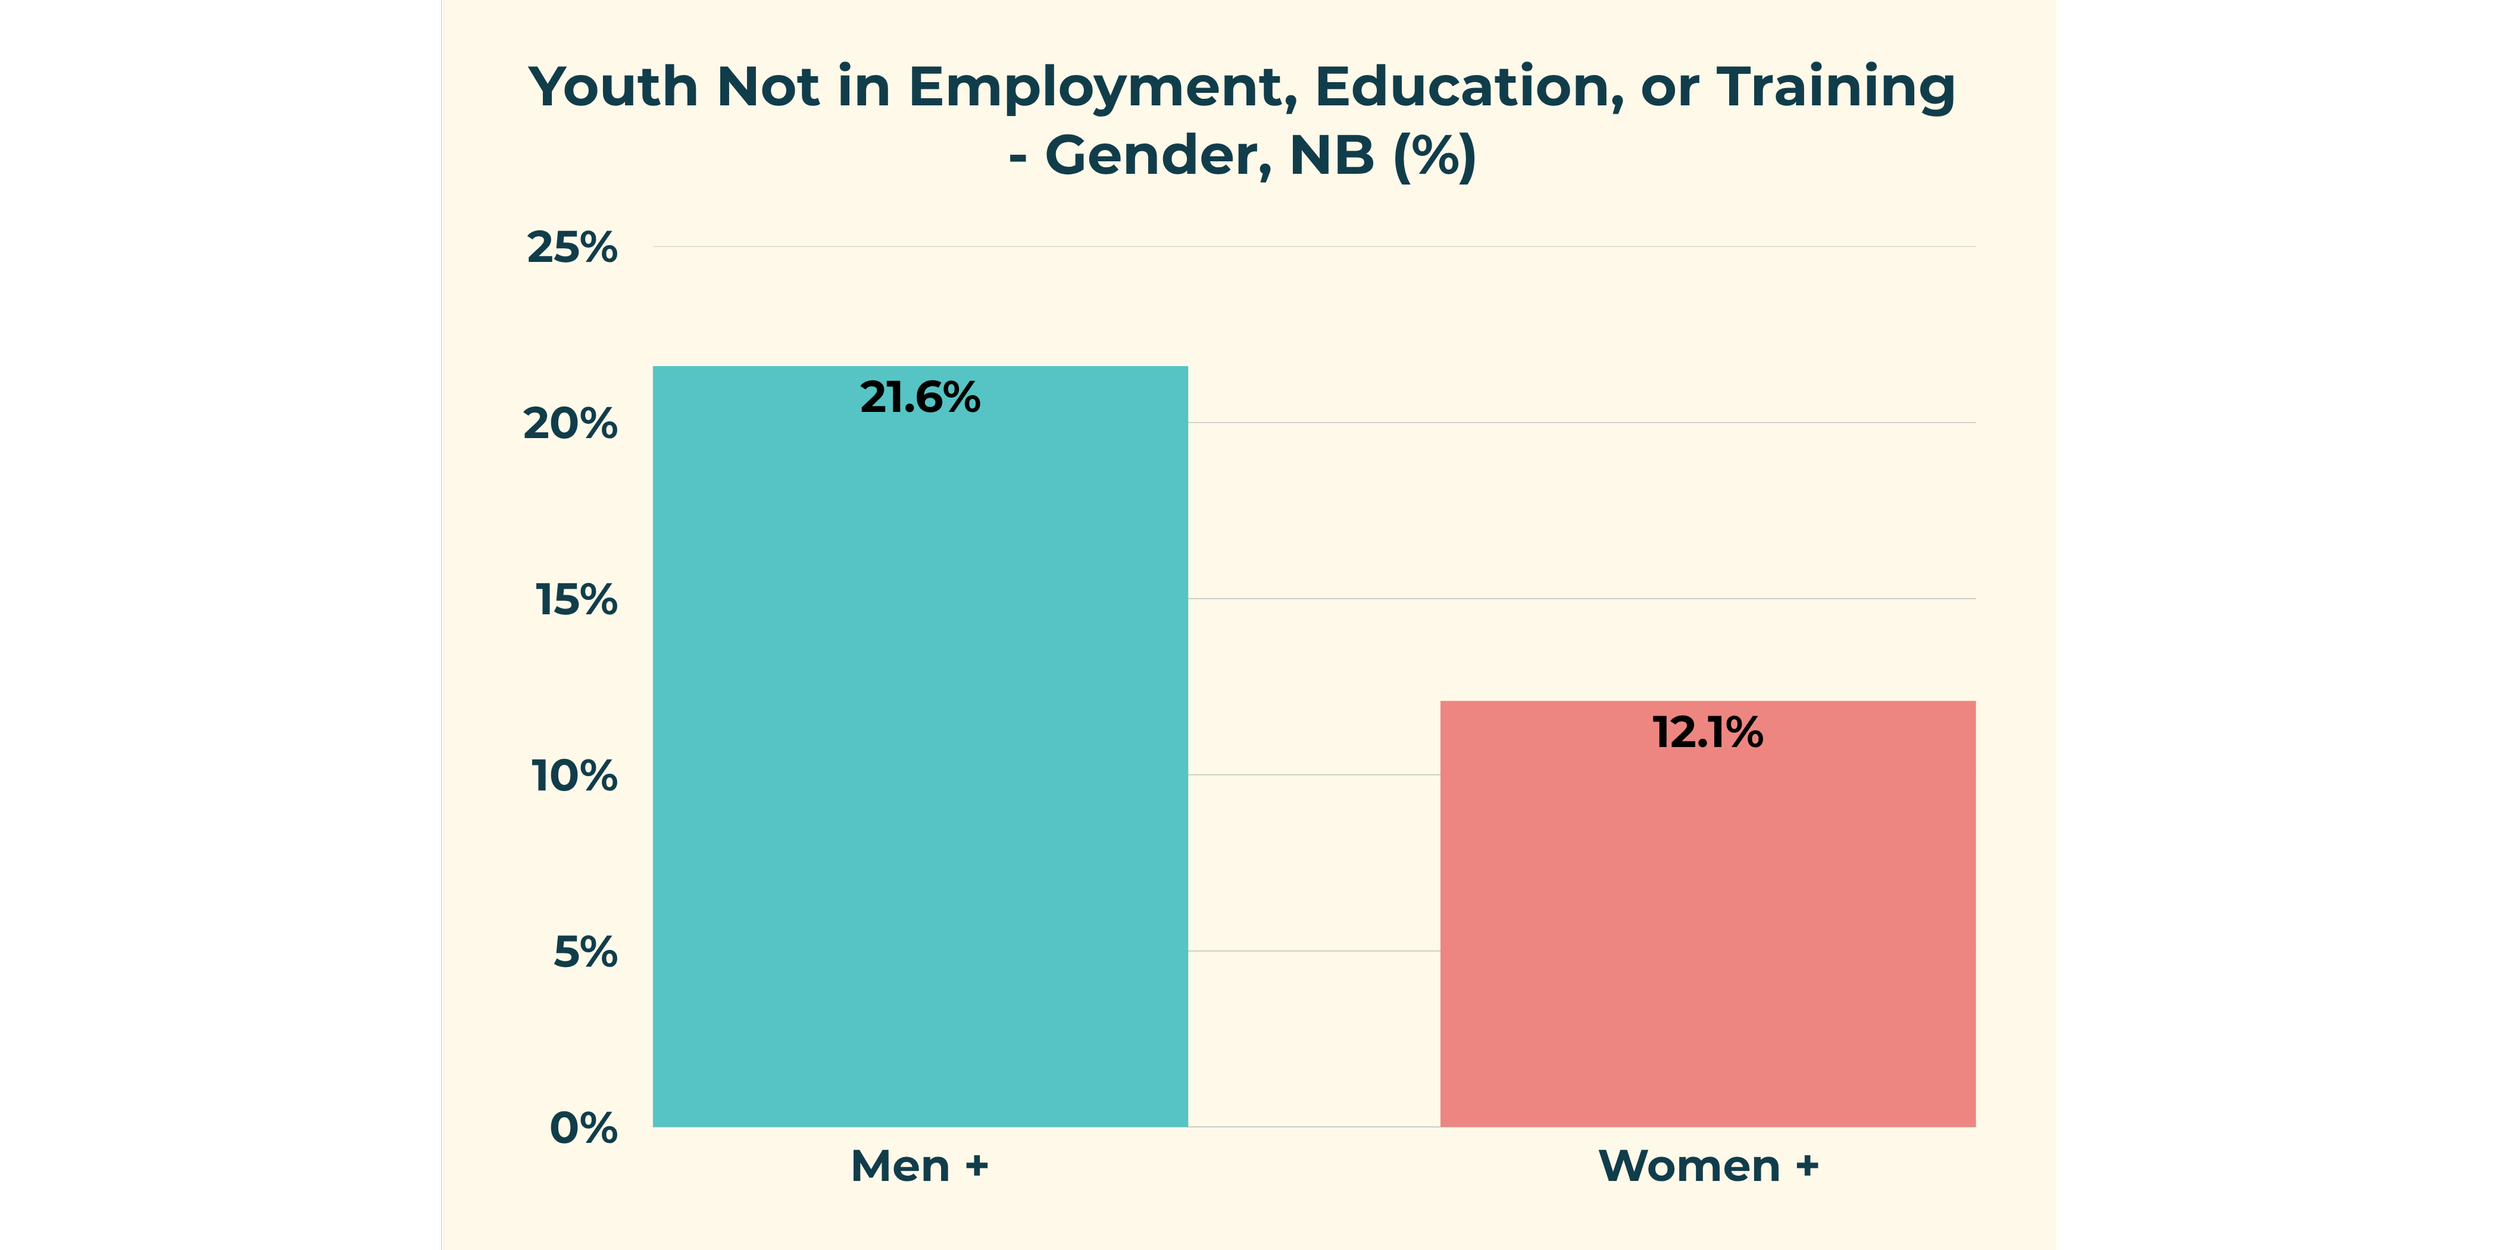
We measure the proportion of youth who are not in employment, education, or training (NEET) because youth who are not engaged in one of these areas may be experiencing difficulties transitioning from school to the labour market, thus increasing their risk of low income and social exclusion. The indicator has been used in Canada since 2009 but has been used by the Organisation for Economic Co-operation and Development (OECD) since the late 1990s.
The NEET rate for young men in their 20s with a bachelor’s degree over this period was driven by their exit from the labour force. Among young women, increased unemployment was offset by increased school attendance.
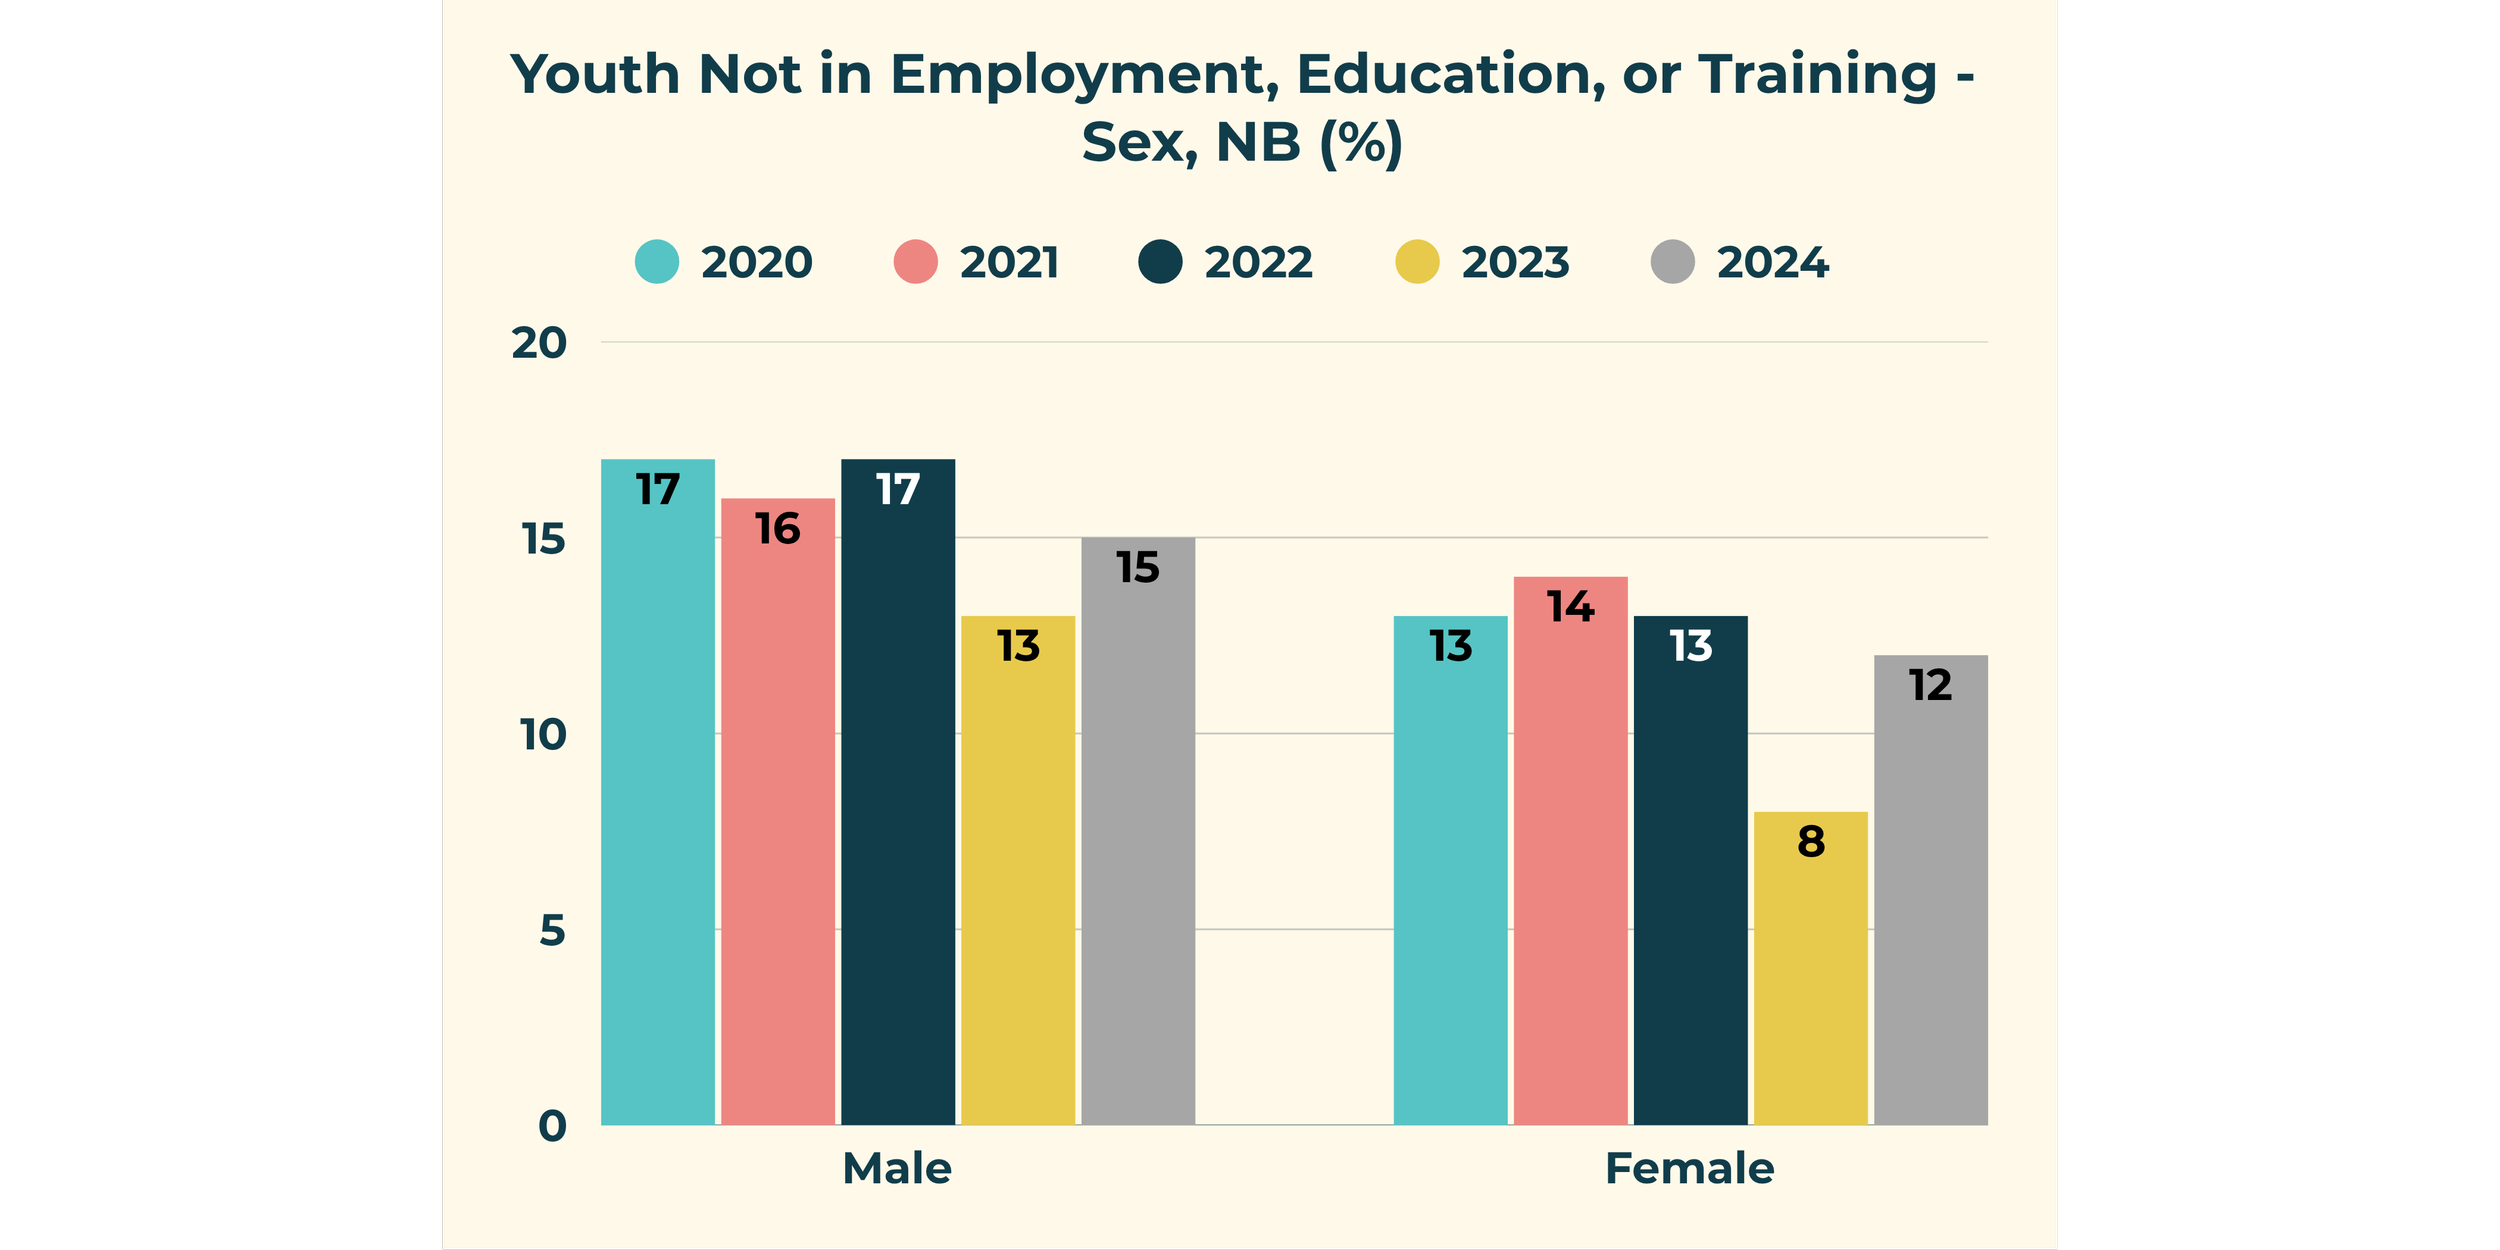
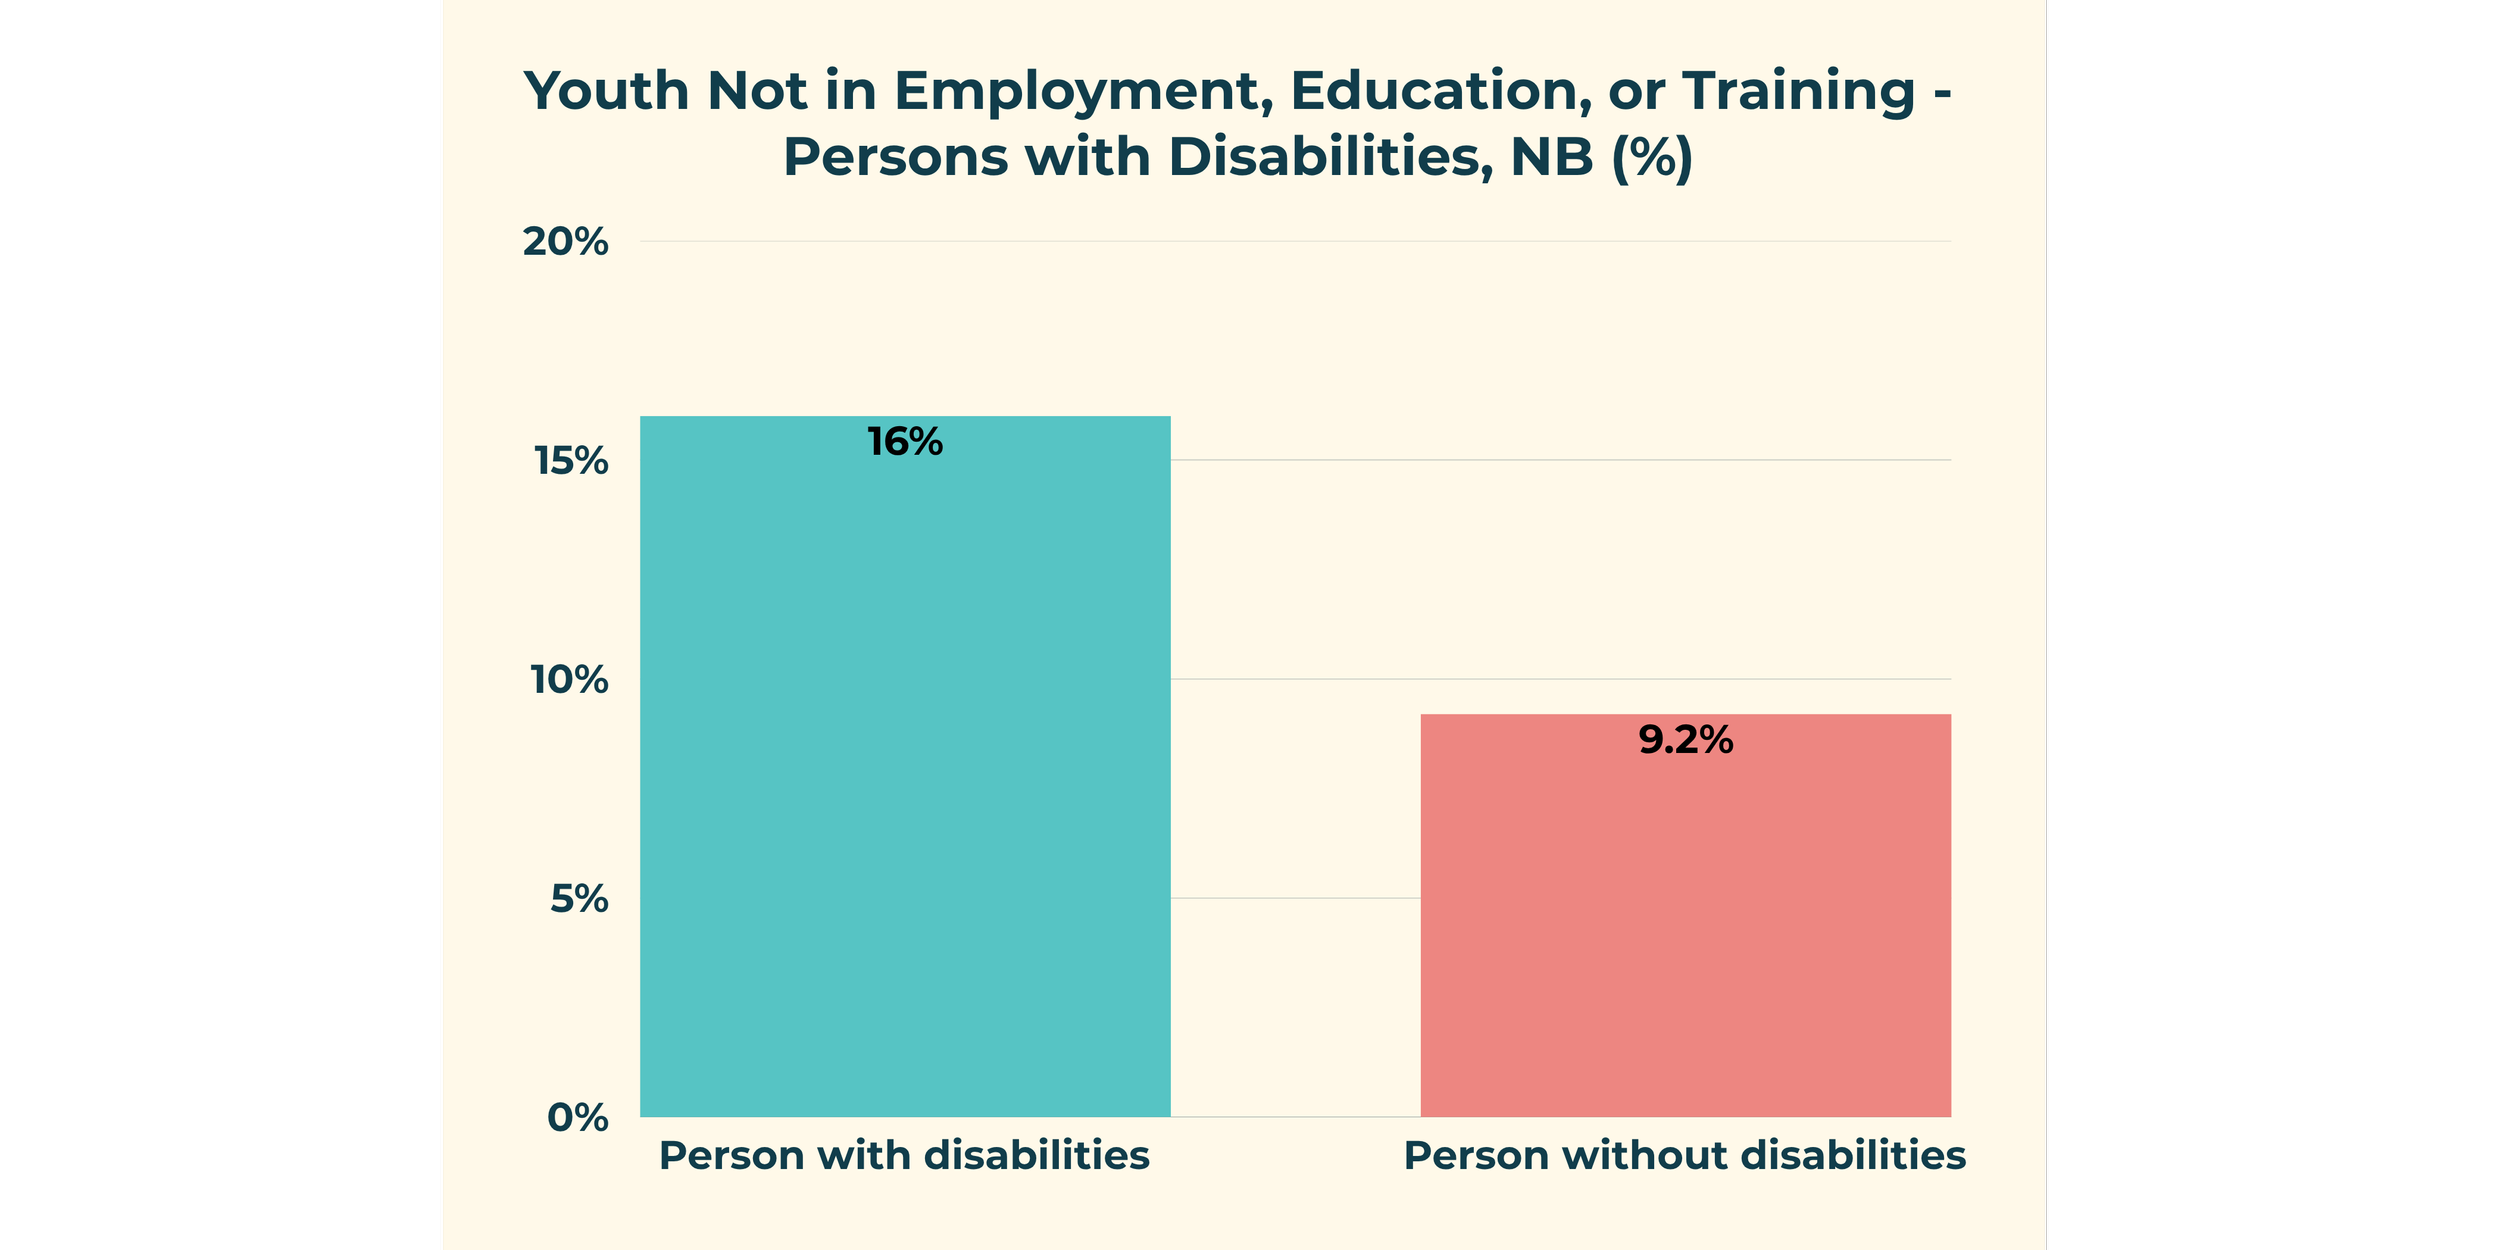
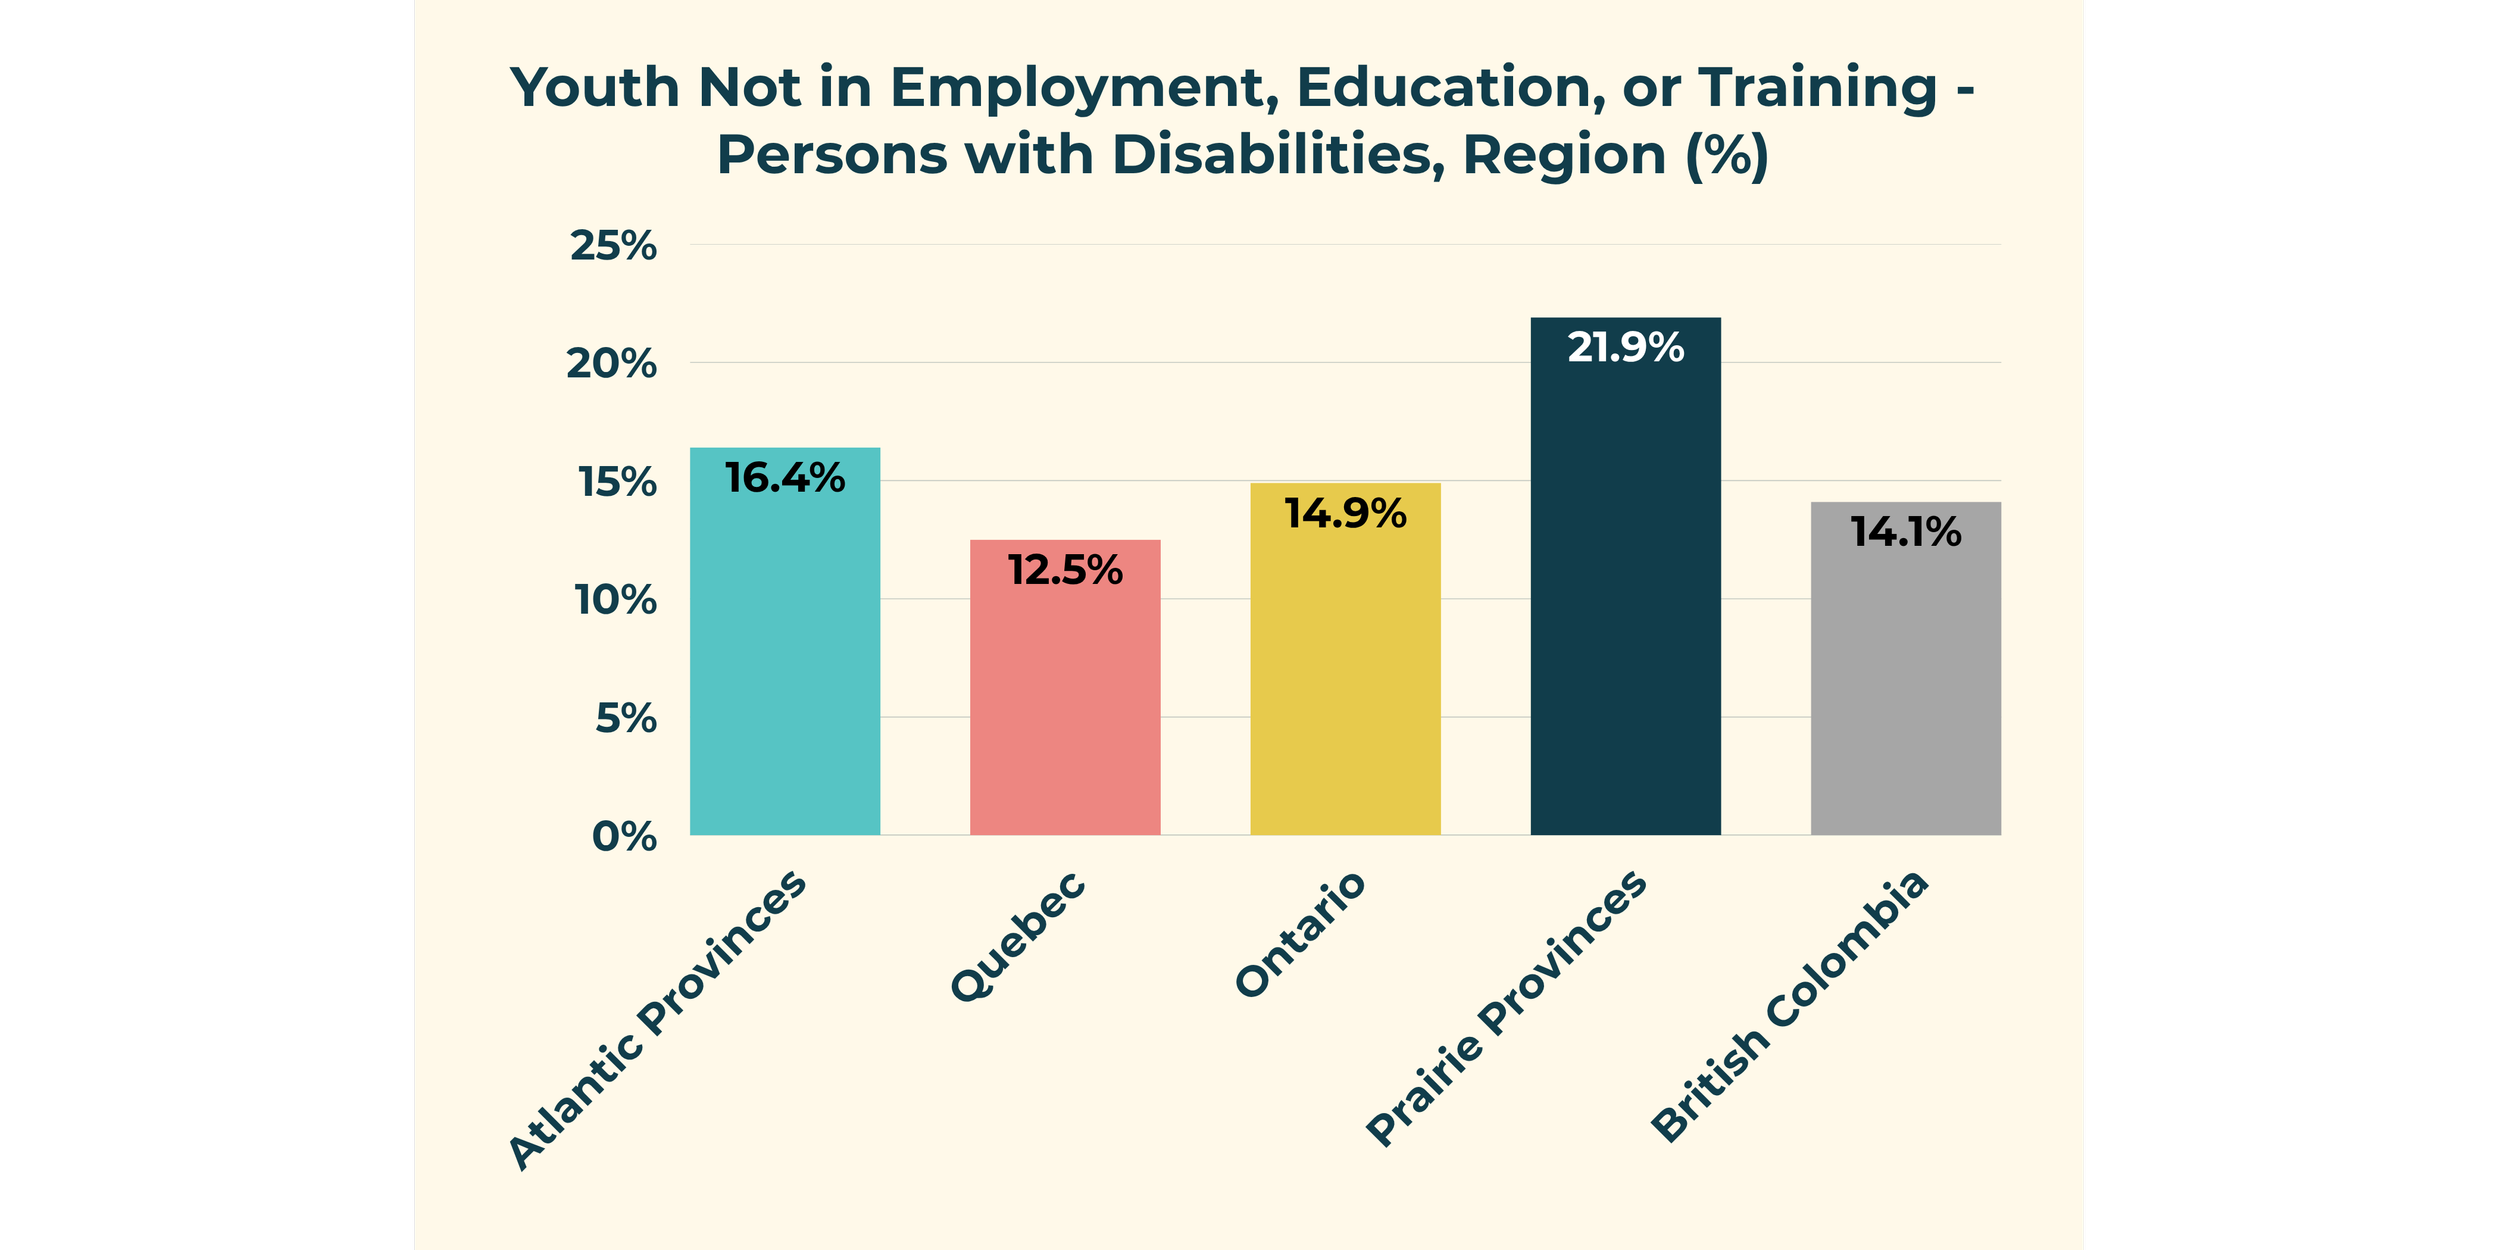
Highly-educated immigrants have been disproportionately affected by rising NEET rates, regardless of their immigration period to Canada or where they received their education.
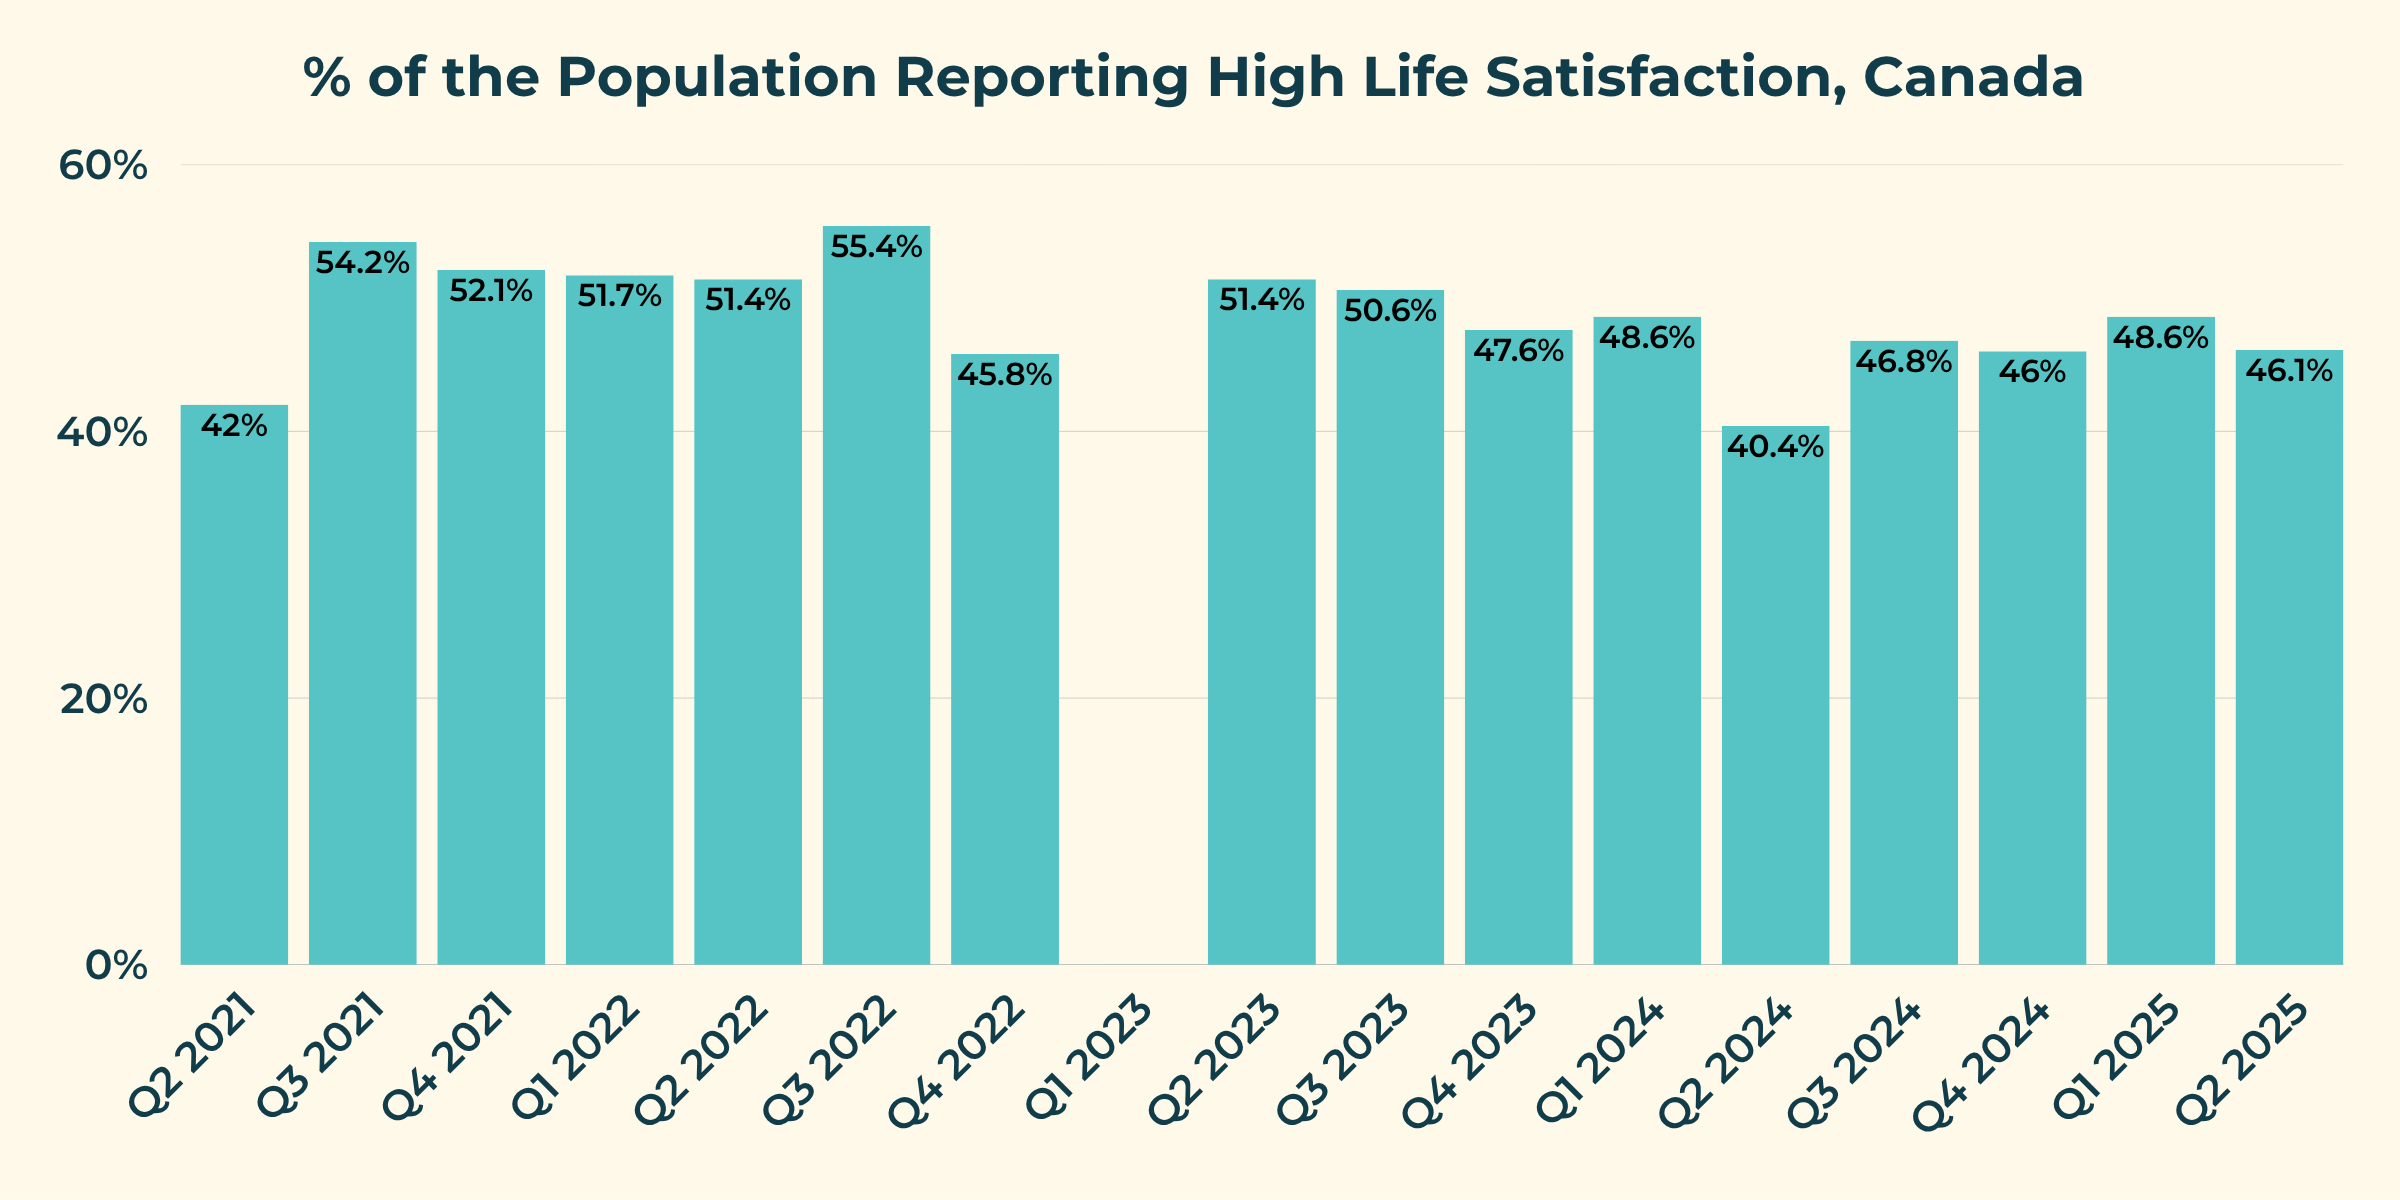
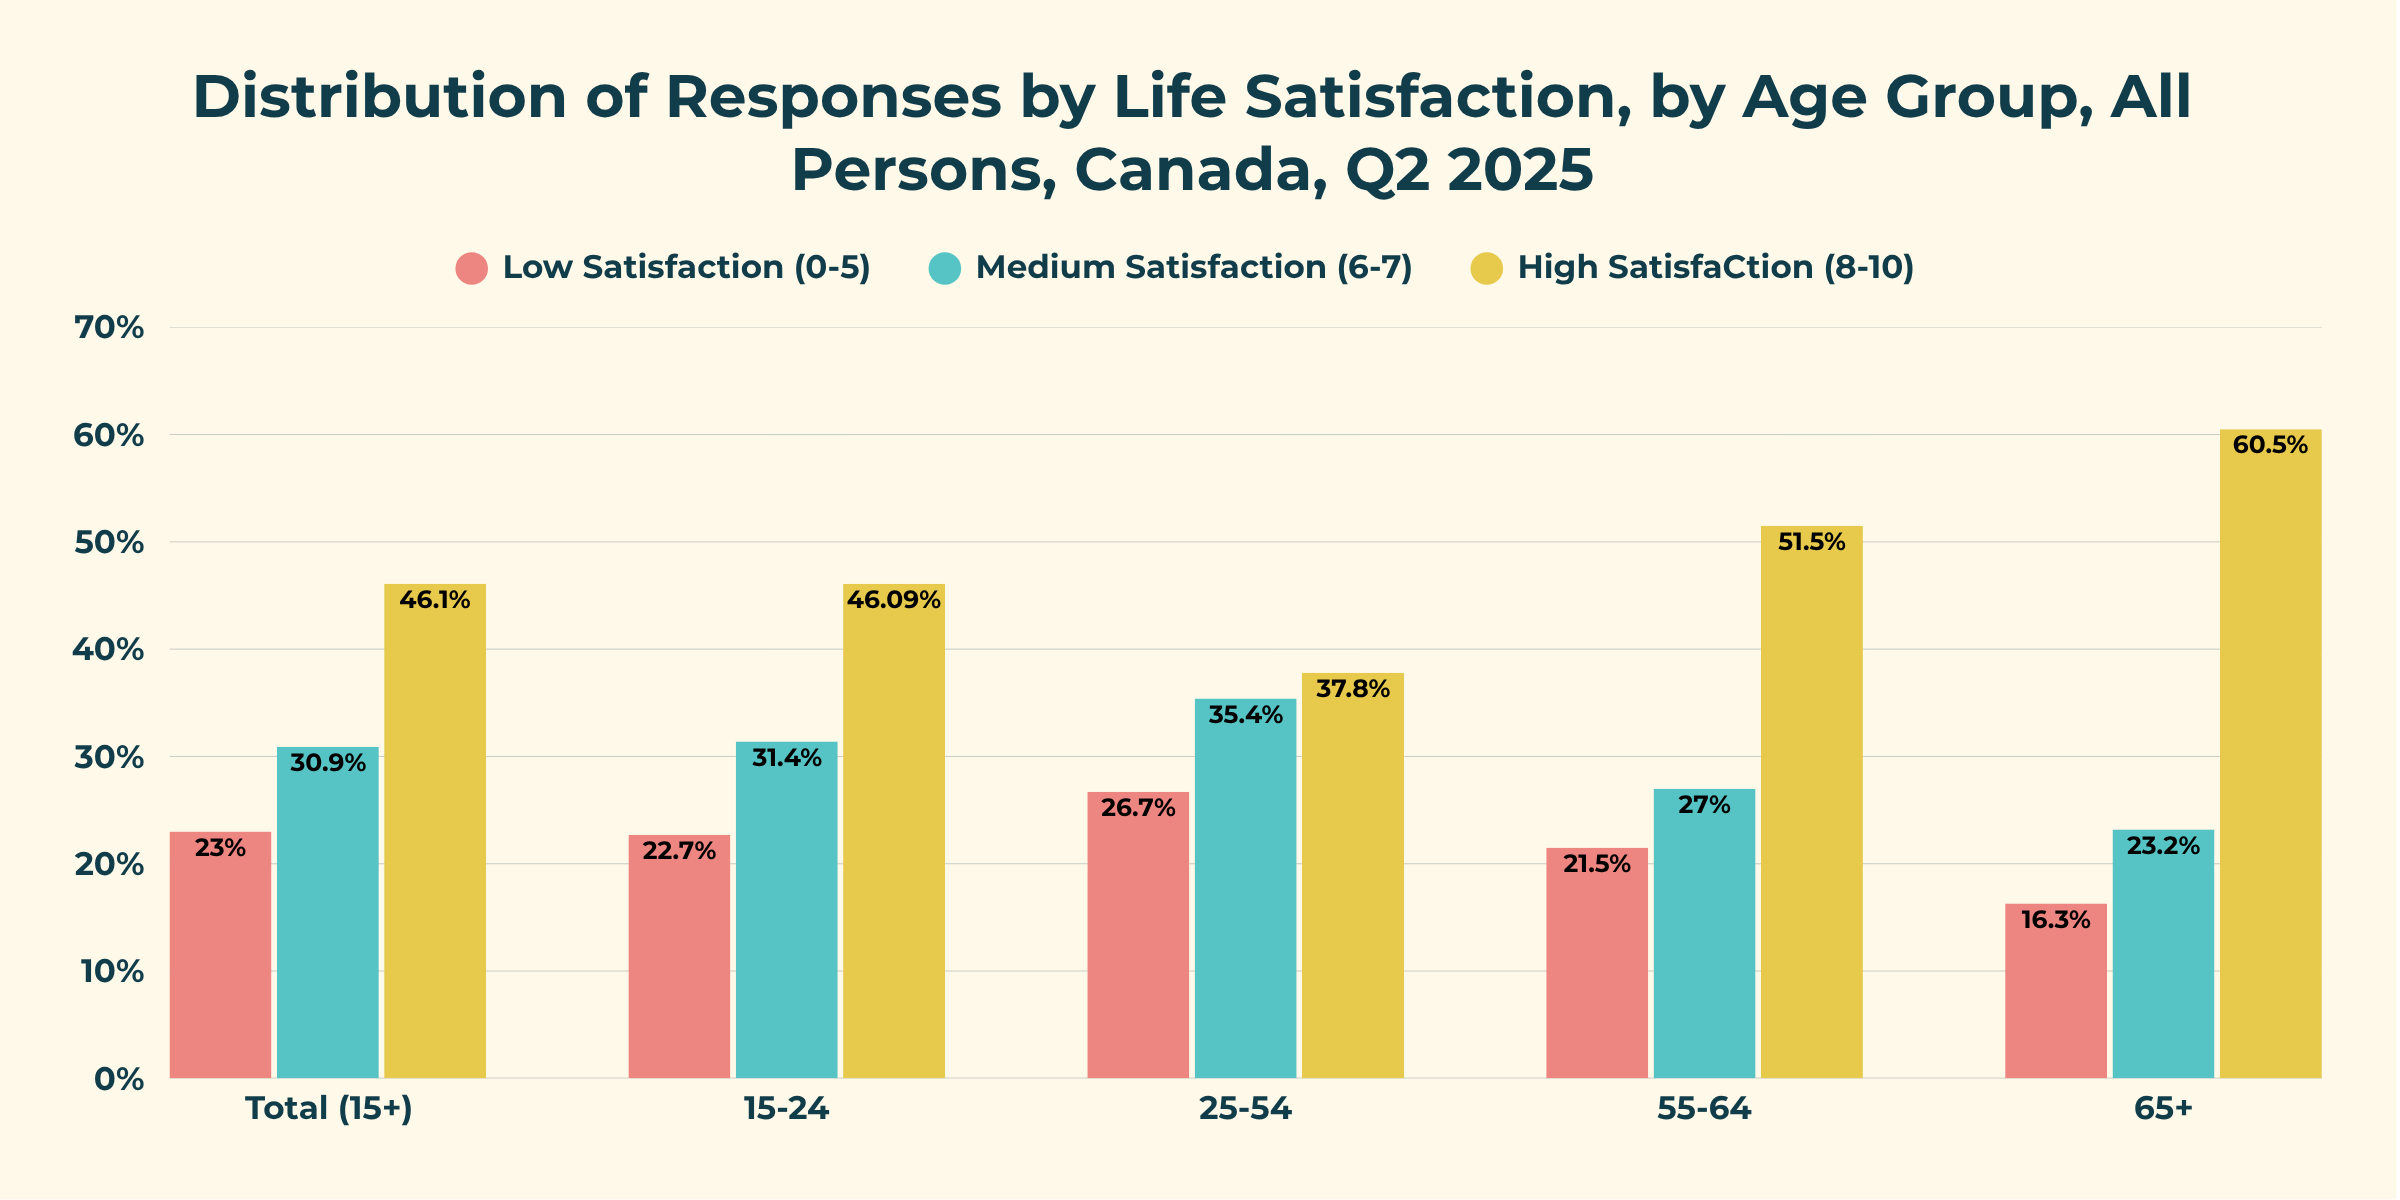
Life Satisfaction
The Quality of Life Framework is a high-level national framework that monitors key determinants of well-being for people living in Canada.
The Framework consists of a set of 92 indicators, organized into a series of domains: prosperity, health, society, environment, and good governance.
Life Satisfaction is a headline indicator meaning it is intended to provide a high-level assessment of overall quality of life in Canada.
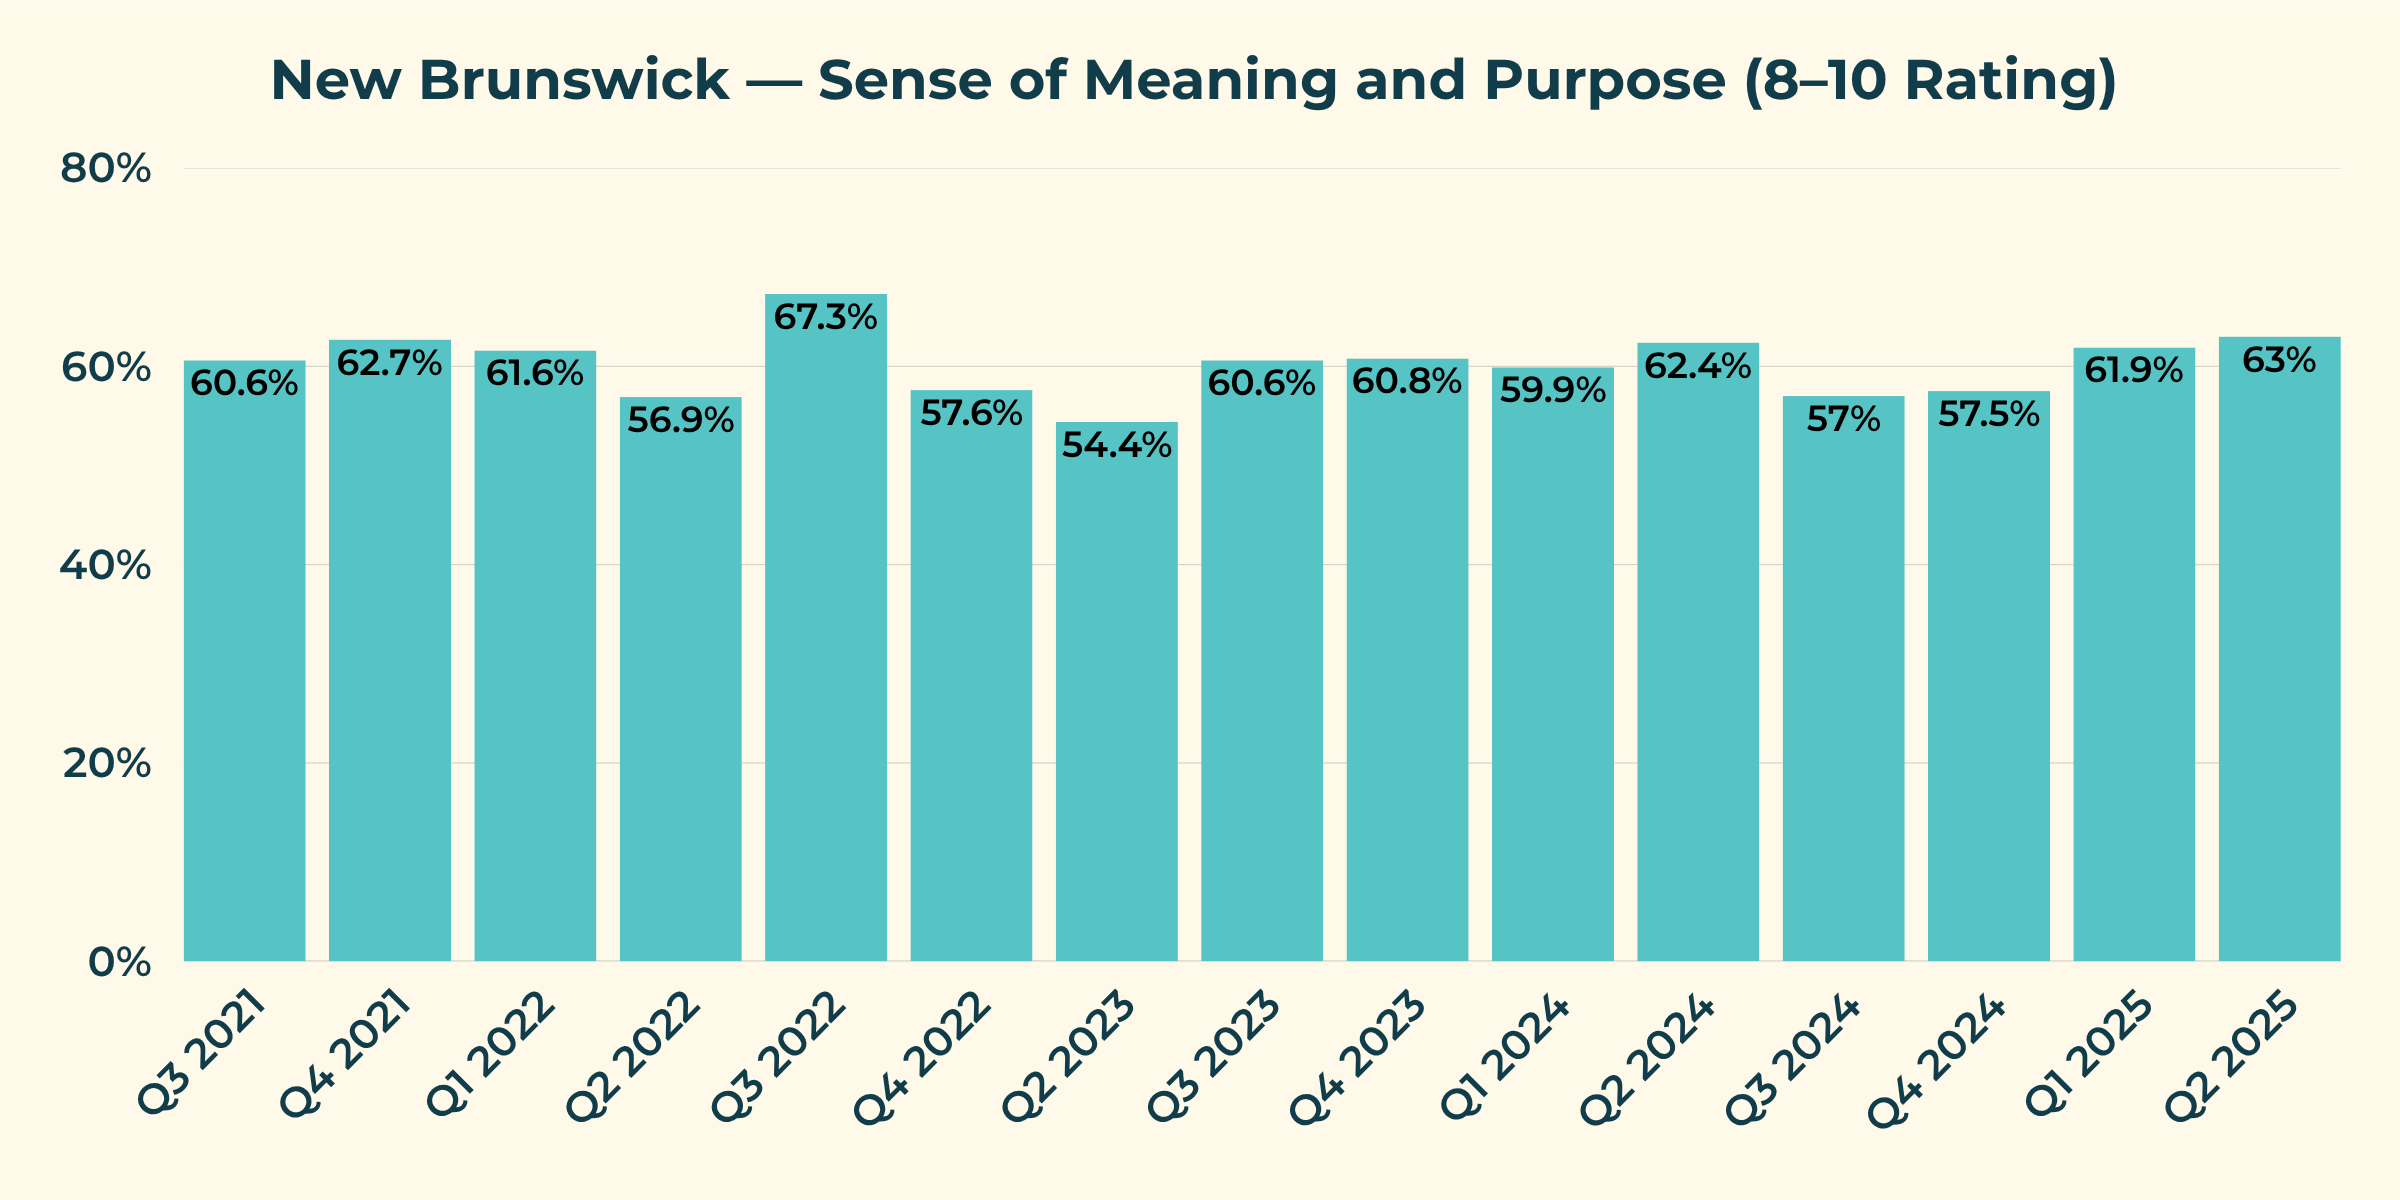
Sense of Meaning and Purpose
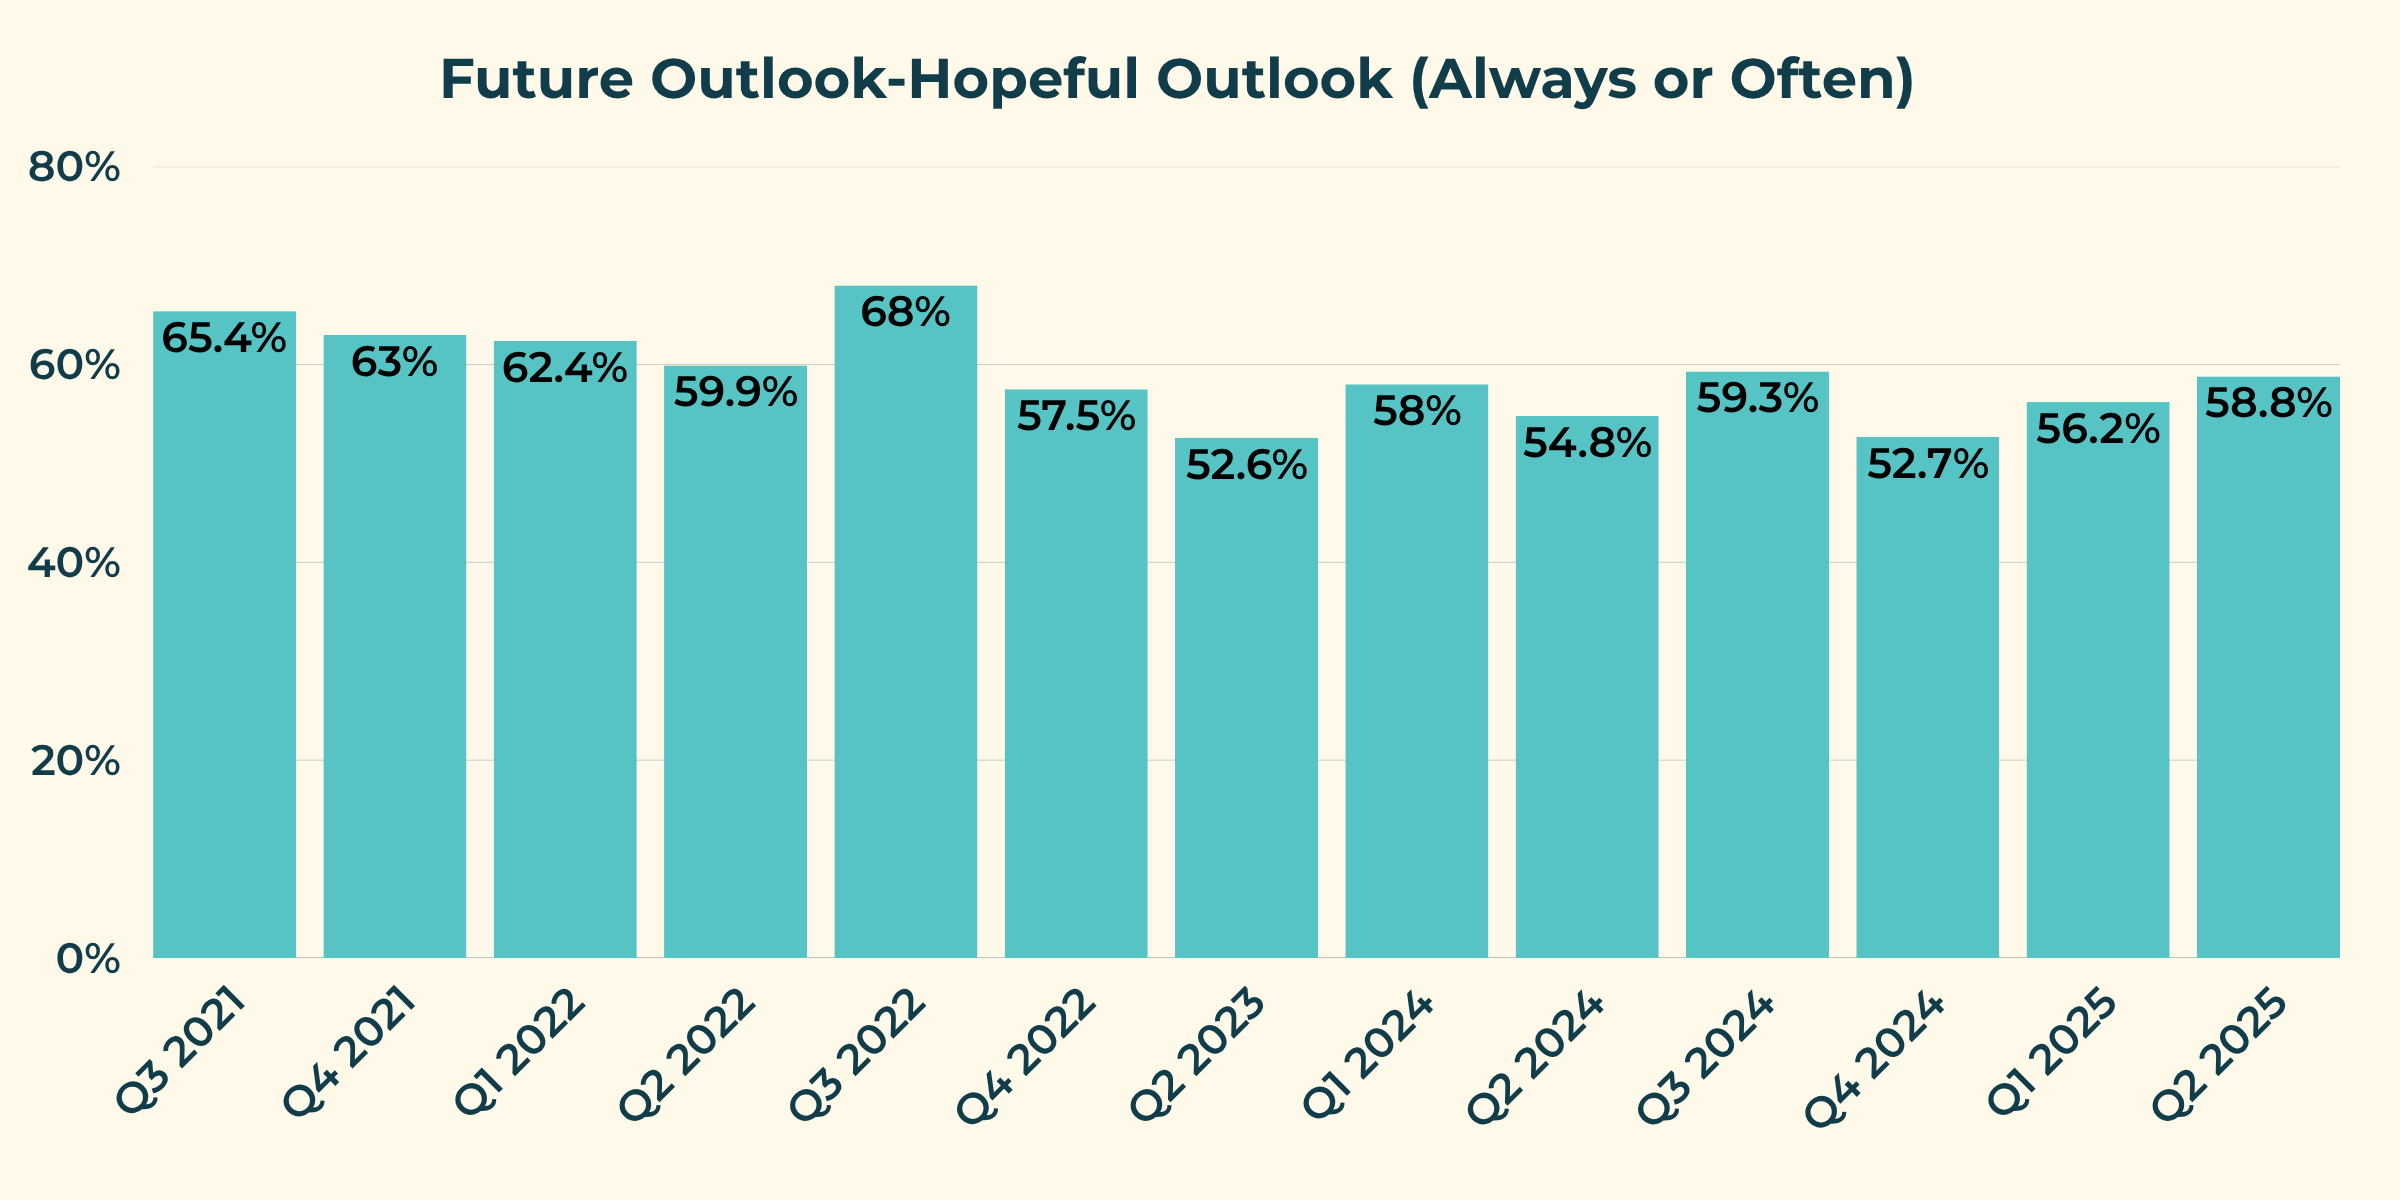
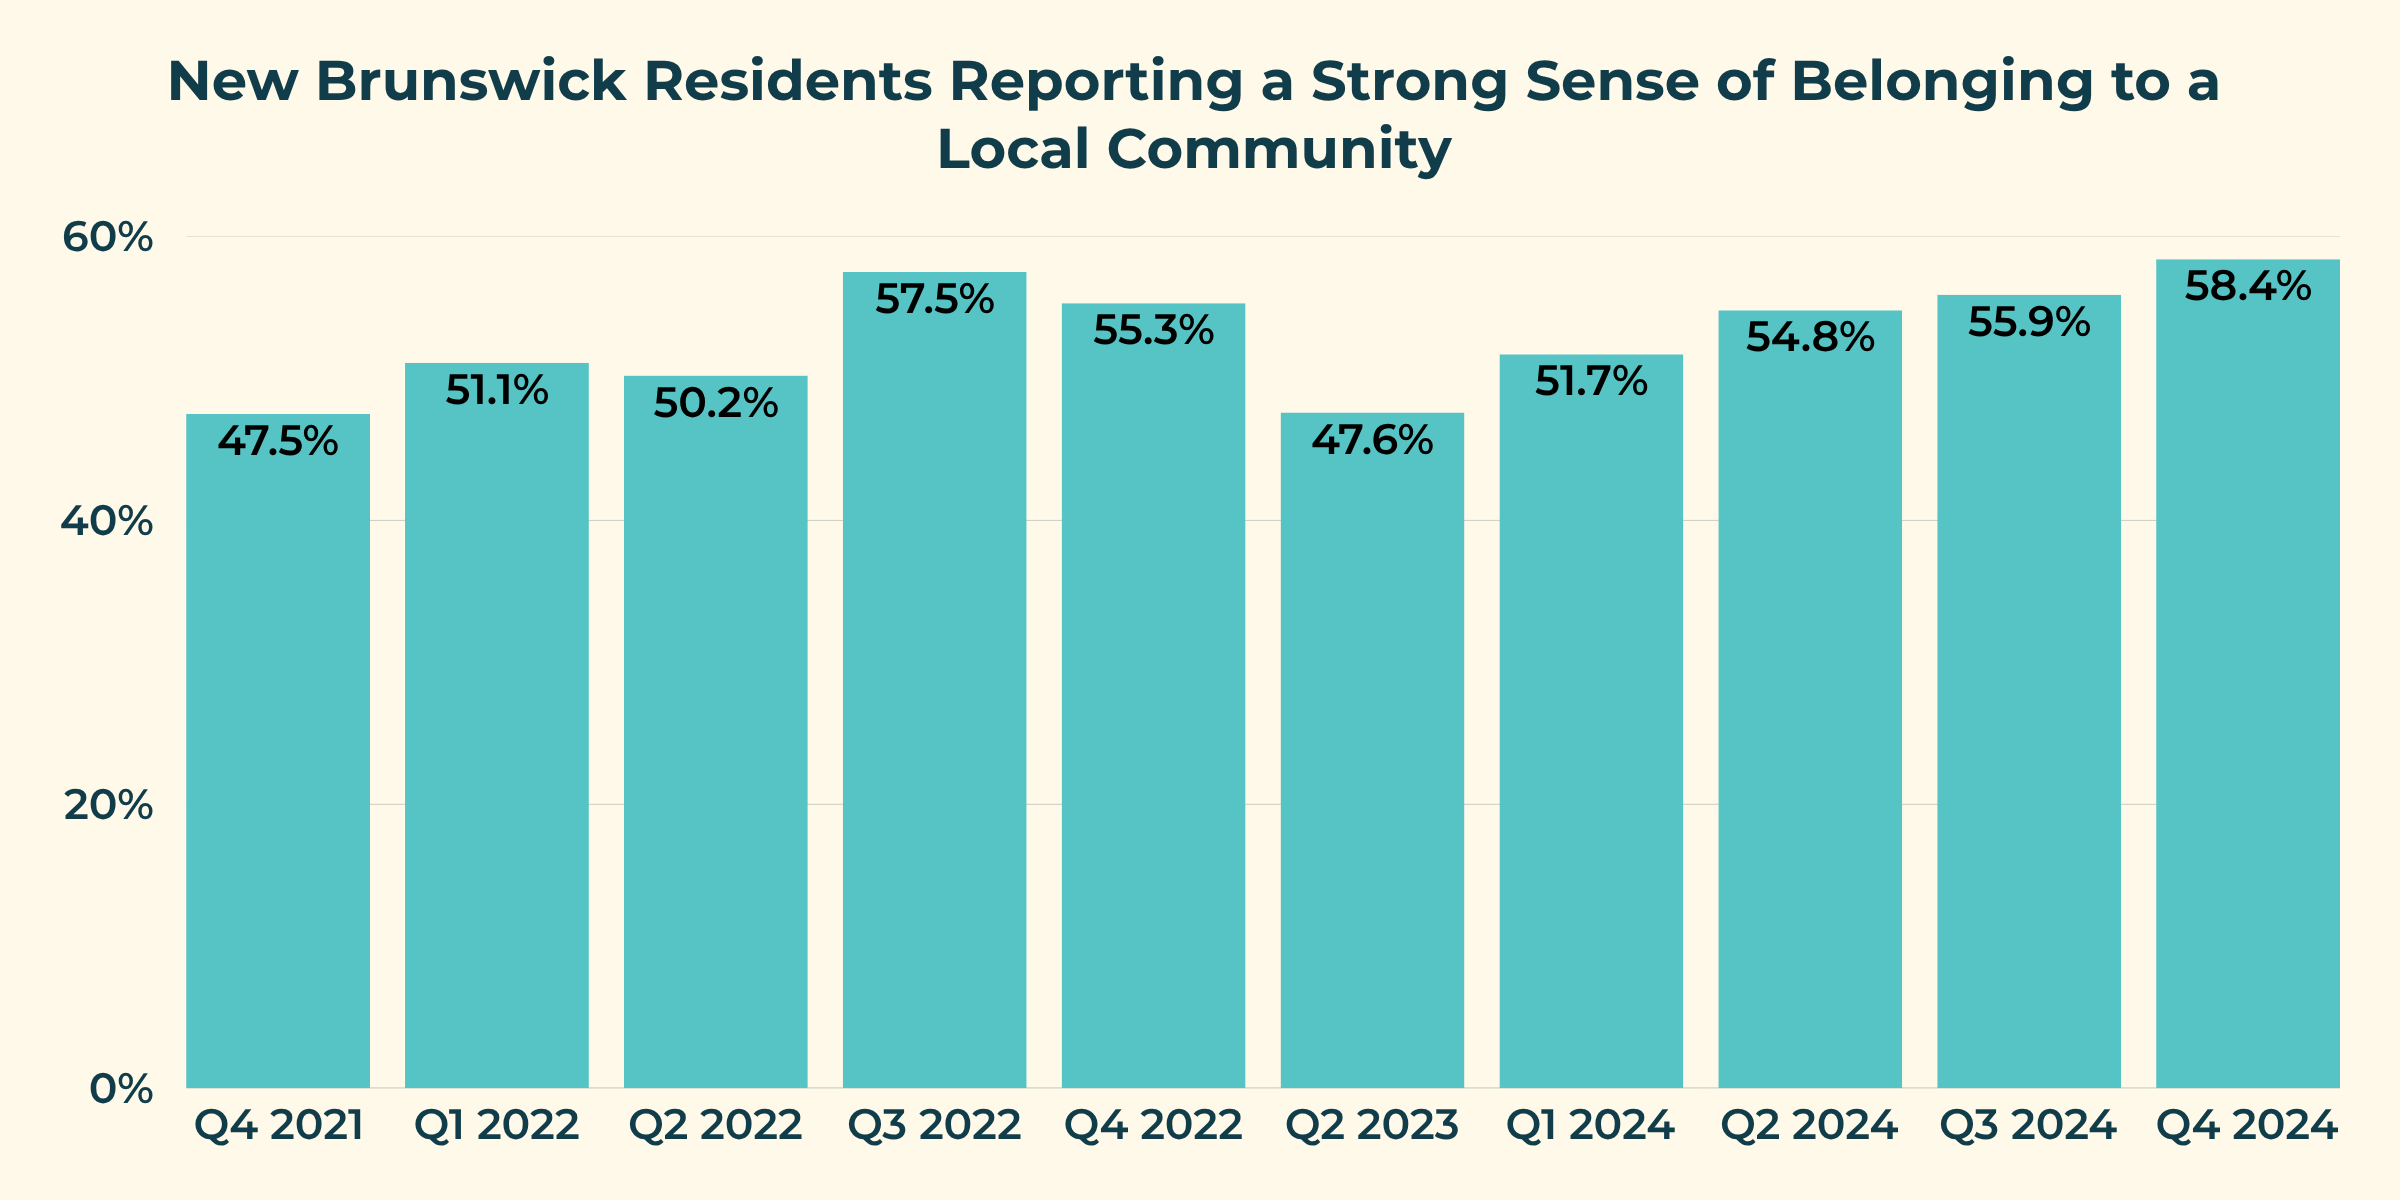
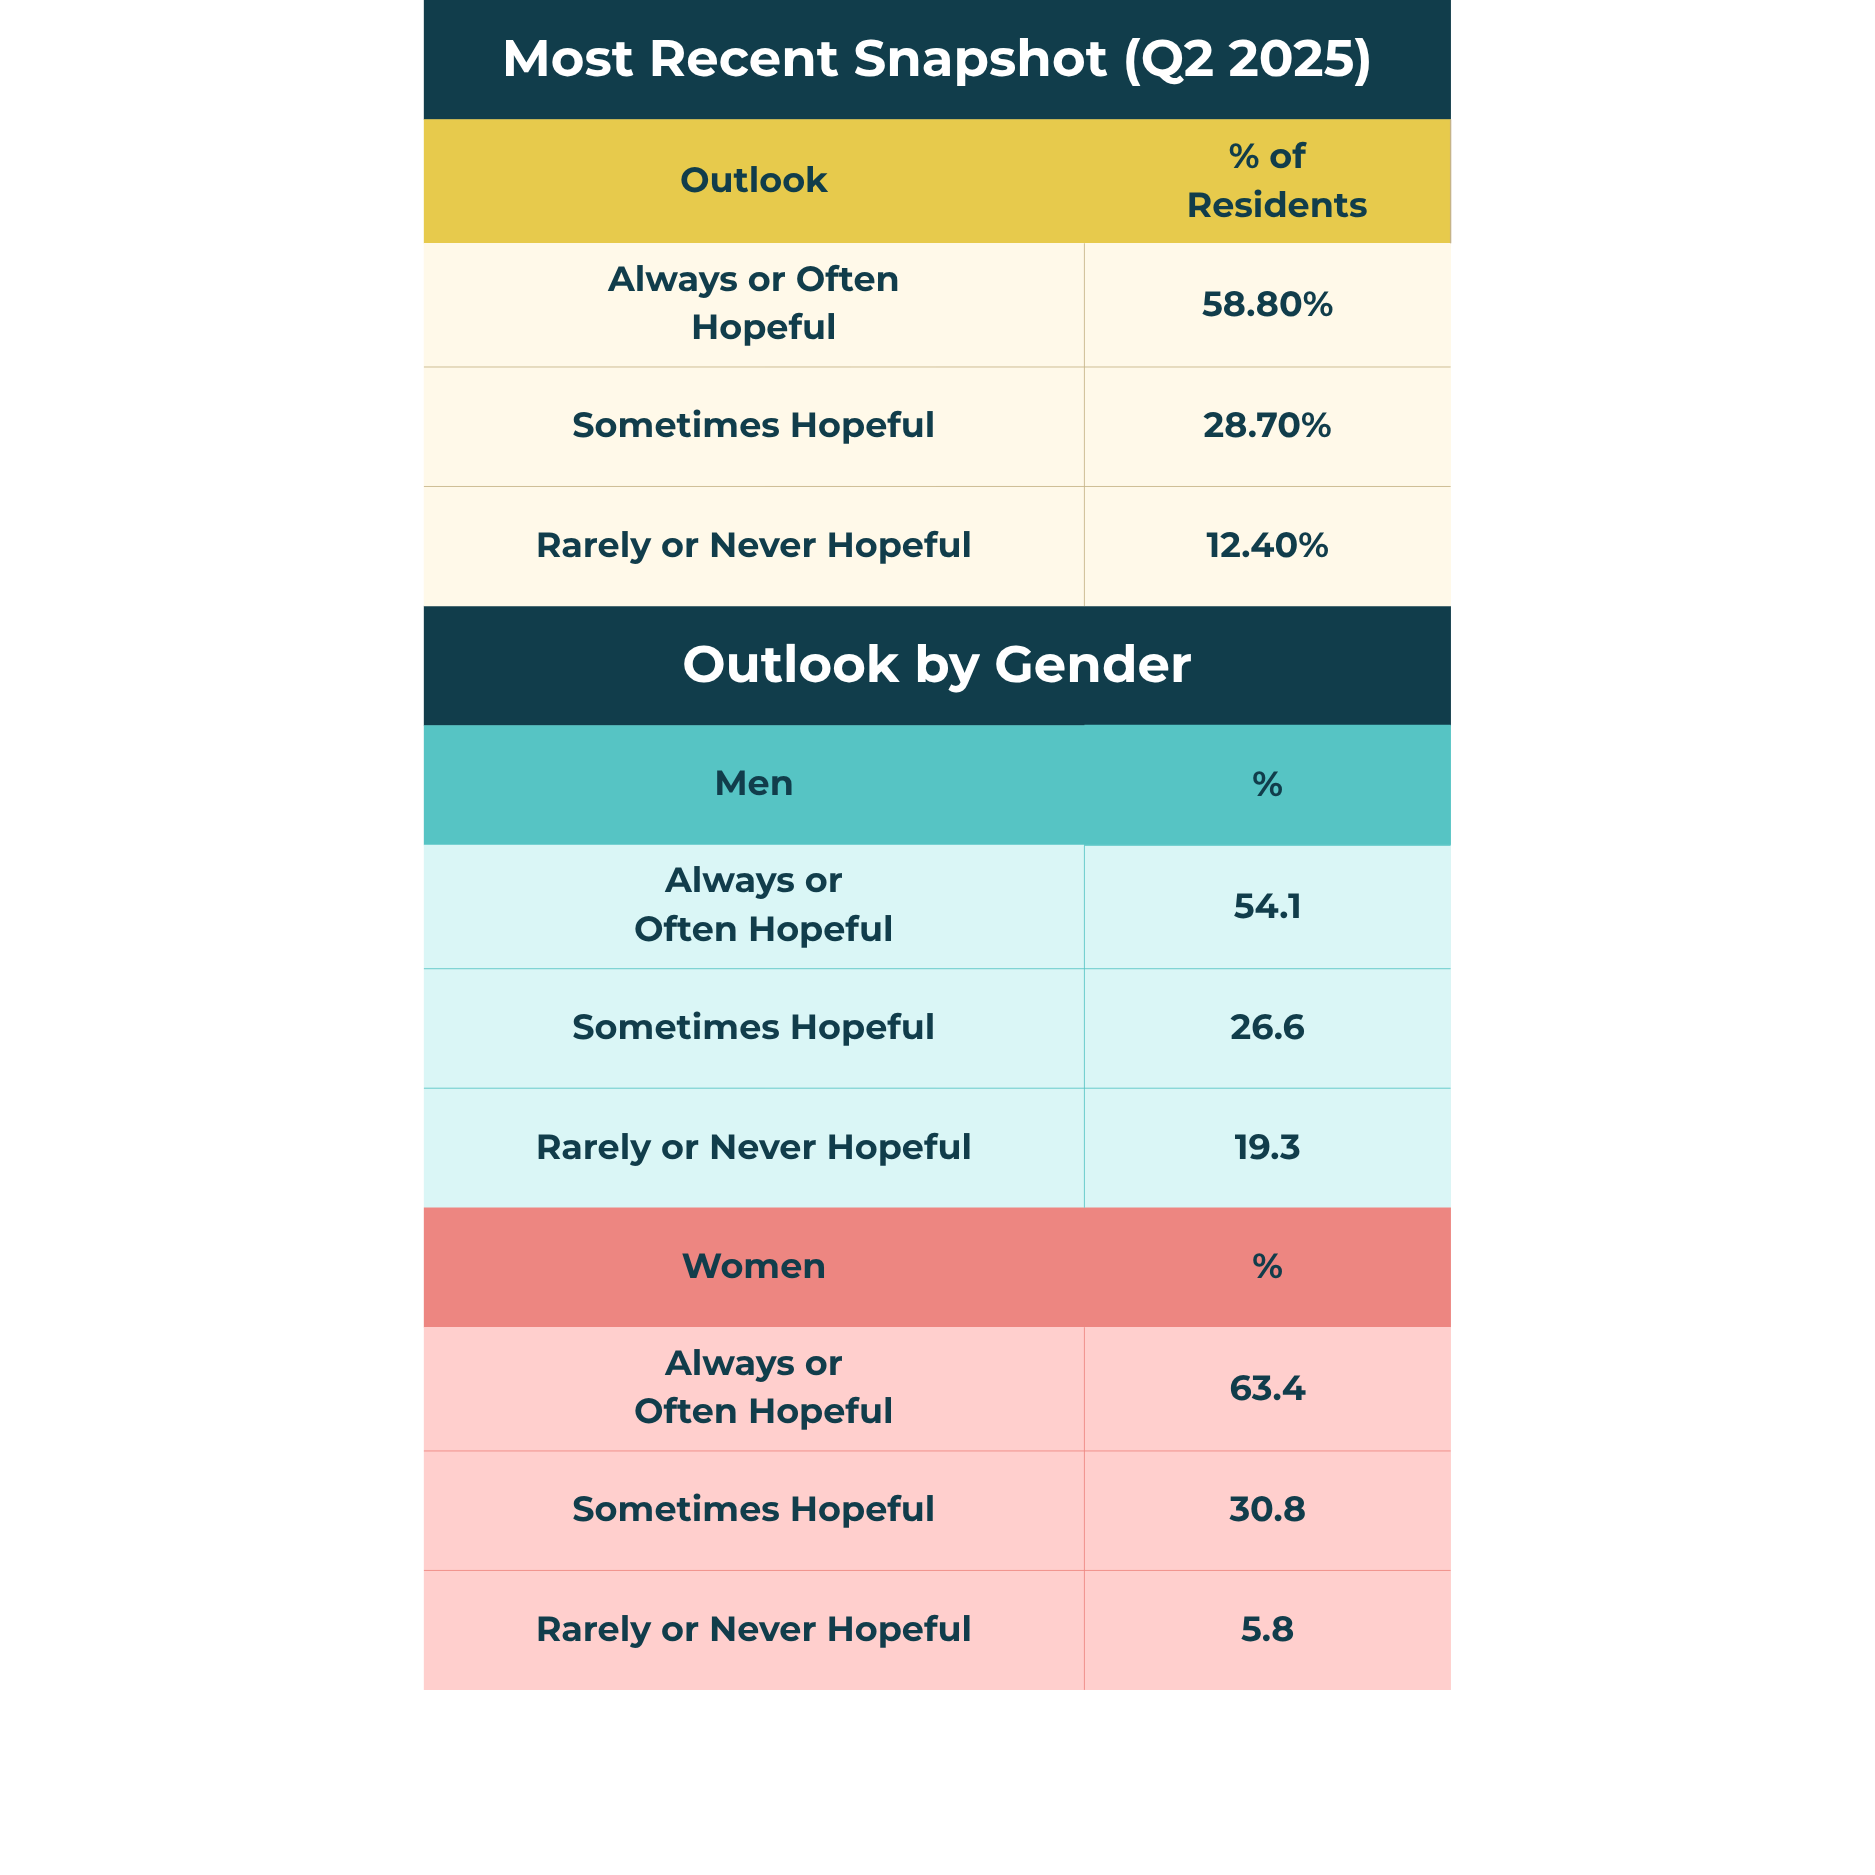
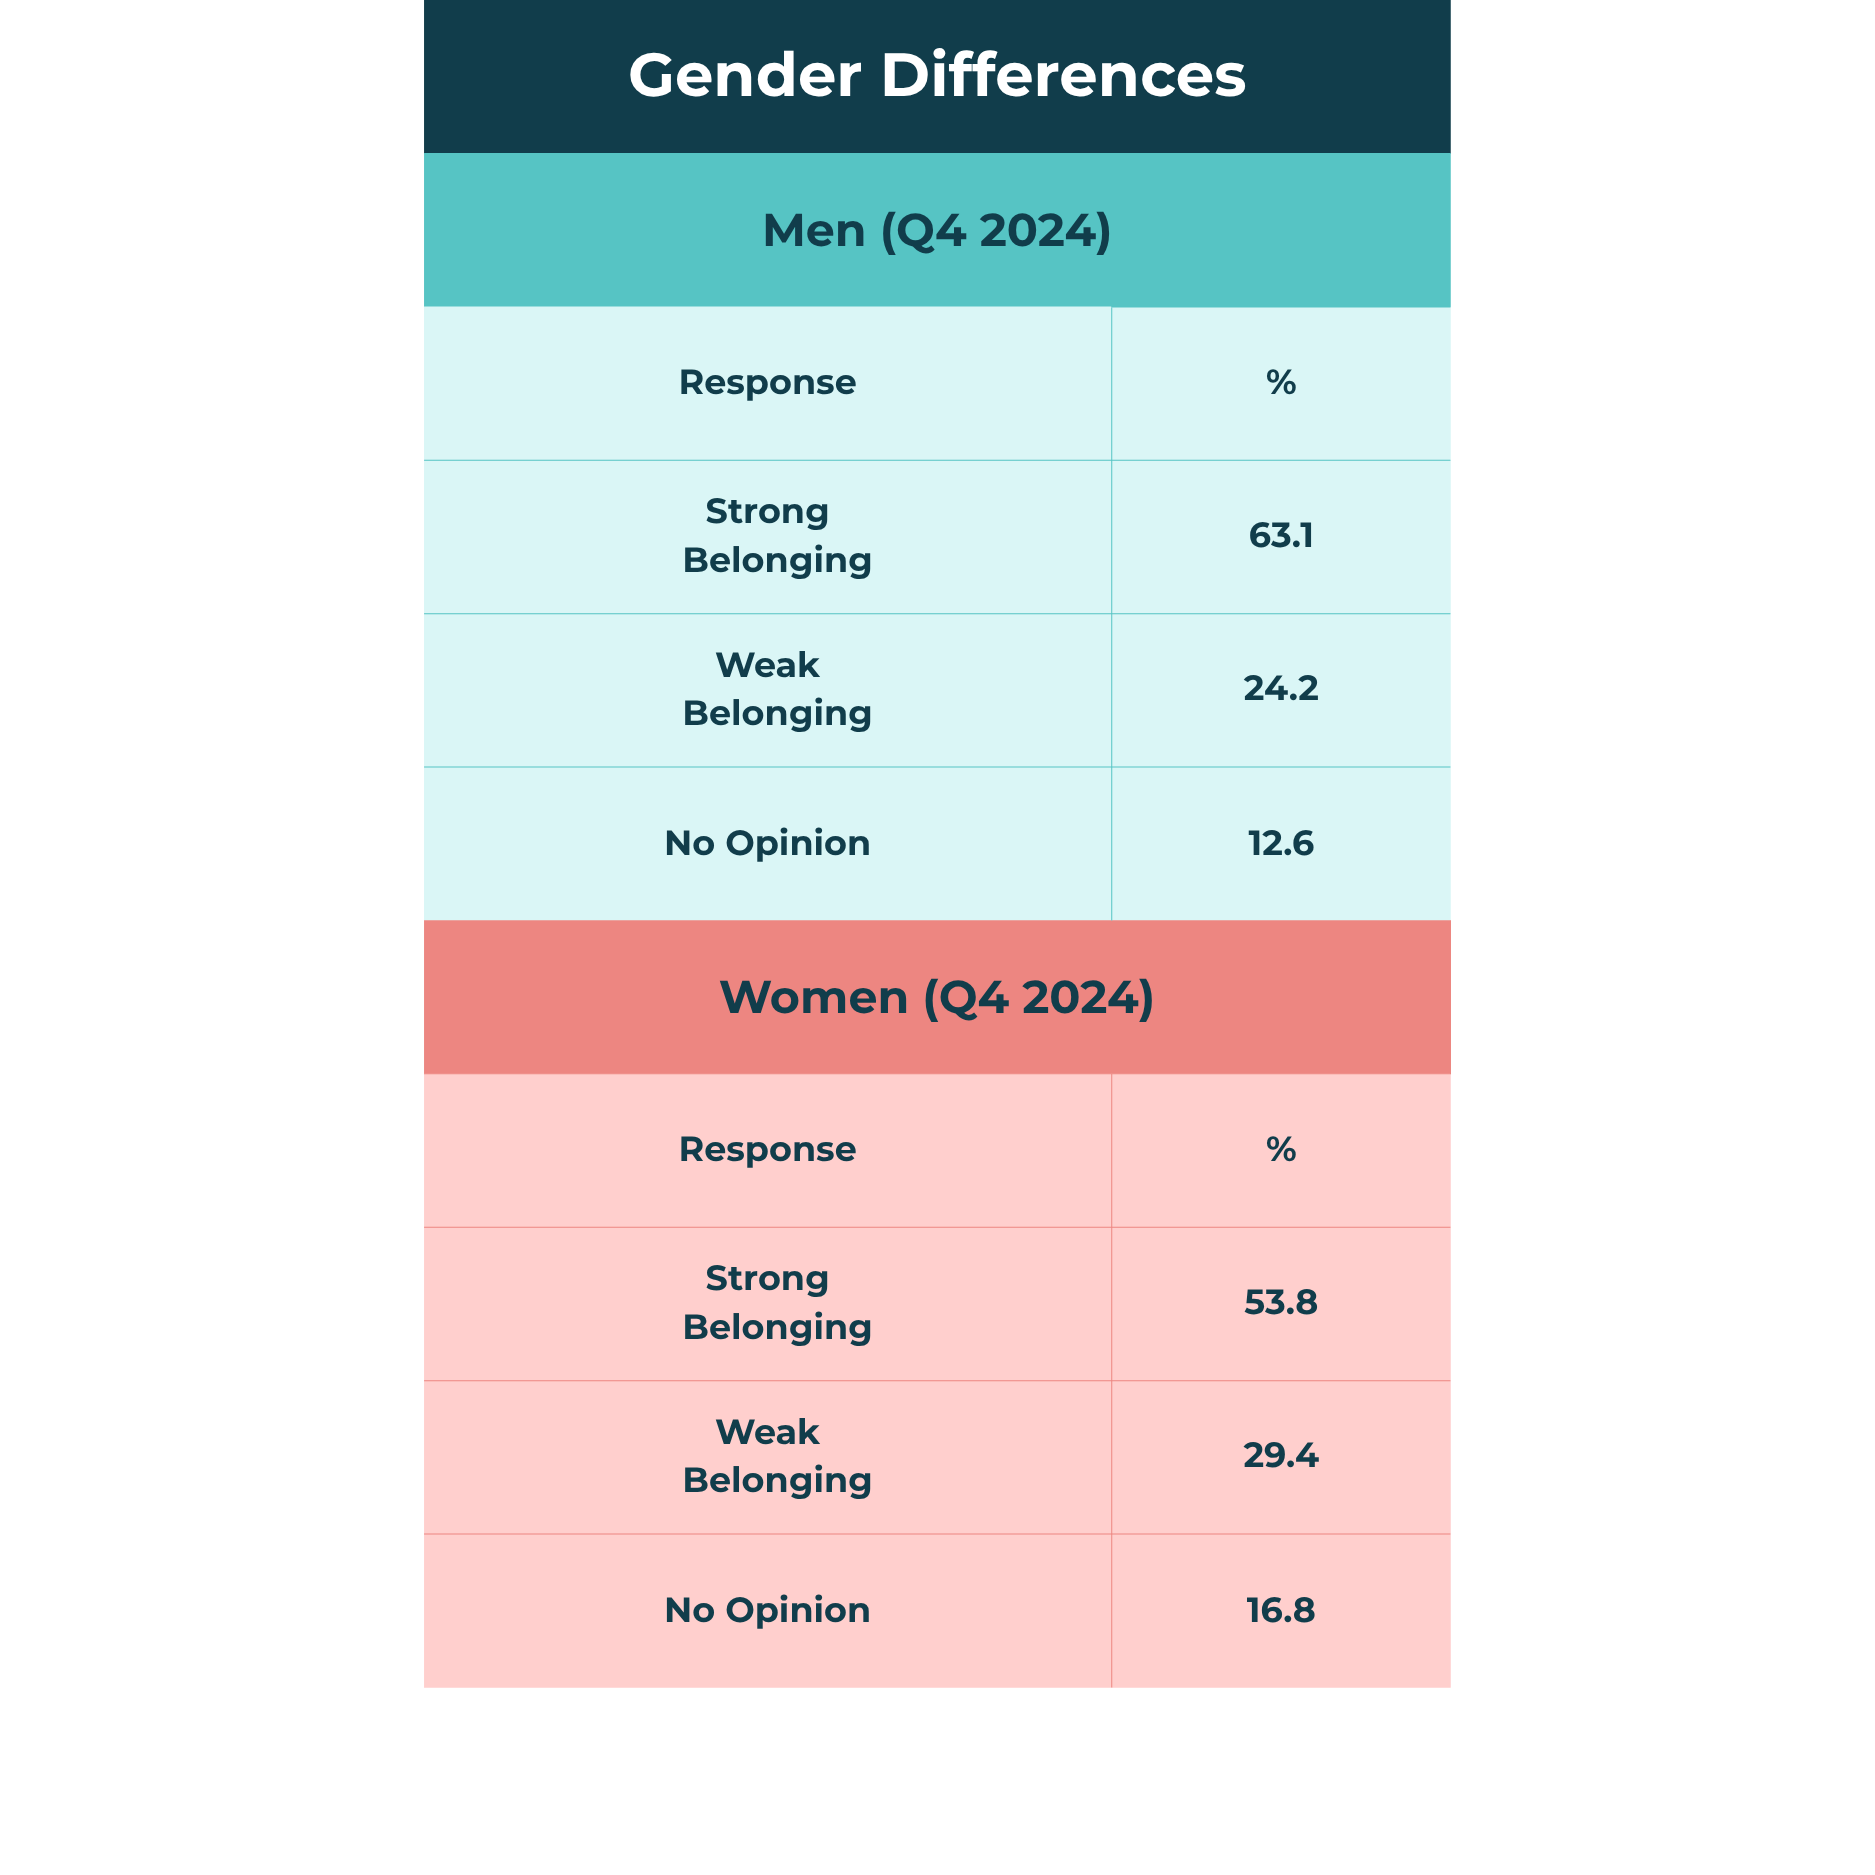
Statistics Canada data relative to the sense of meaning and purpose reflects the feelings of New Brunswickers who feel strongly connected to their lives and future. Despite affordability pressures, roughly two-thirds of New Brunswickers continue to report a strong sense of meaning and purpose.
Food Insecurity:
Refers to people who live in households that experience marginal, moderate, or severe food insecurity.
Economic Family:
Means a group of two (2) or more people who live in the same house and are related by birth, marriage, living together as a couple, adoption, or foster care.
Racialized Person/Family:
This term comes from “visible minority”. A visible minority means someone who is clearly part of a racial group that is not white, according to the Employment Equity Act. The Act says visible minorities are people who are not Indigenous and who are either not white or not of European background.
Senior Family:
Refers to a family where the highest-income earner is 65 years or older.
Non-Senior Family:
Refers to a family where the highest-income earner is younger than 65 years.
Definitions
Housing Insecurity:
Housing is a human need that provides shelter, a place to share with others, as well as an important determinant of health. People who experience housing insecurity are lacking proper shelter.
Core Housing Need:
Households in core housing need live in an unsuitable, inadequate, or unaffordable dwelling and cannot afford alternative housing in their community.
NEET:
The number of people who are not attending high school, college, CEGEP, university, or equivalent and are not employed, as a percentage of the population aged 15 to 29 years.
Living Wage:
The hourly wage a worker needs to earn to cover their basic expenses and participate in their community.